Engineered Foresight :: Clarity Under Uncertainty
In volatile markets, sound decisions are rarely made with perfect information. Foresight, as we define it, is not prediction—it is the structured understanding of uncertainty that enables confident action when facts are incomplete.
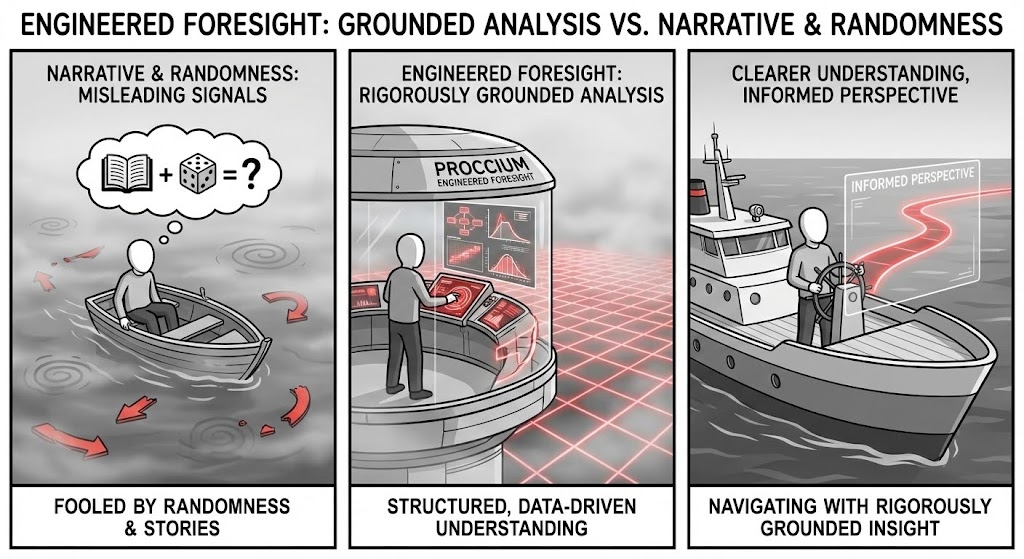
At Proccium, we develop models that quantify uncertainty, rigorously test assumptions, and frame decisions under risk. Our models are transparent, data-driven, and fully auditable, helping leaders allocate capital, evaluate exposure, and act with confidence in environments where volatility is the rule, not the exception.
In the complex arenas of industrial strategy and capital deployment, decisions are often stalled by the perception that critical variables—such as political risk, technological adoption rates, or market sentiment—are inherently “unmeasurable.” At Proccium, we fundamentally reject this notion. We understand that if a factor impacts a decision, it possesses observable attributes and, therefore, can be measured.
We deploy rigorous analytical techniques to break down seemingly intractable problems into quantifiable components. By defining clear measurement intentions, leveraging empirical data (even sparse data through Bayesian methods), and systematically reducing uncertainty through calibrated models, we transform qualitative assertions into actionable, auditable insights.
Our methodology is grounded in the principles of Applied Information Economics. We reject the defeatist notion that critical strategic factors—reputation, cyber-risk, strategic alignment, or innovation capability—are "intangibles" that defy measurement. If a factor matters, it has an observable effect; if it has an observable effect, it can be measured.
We translate the teachings of decision science into a coherent industrial workflow:
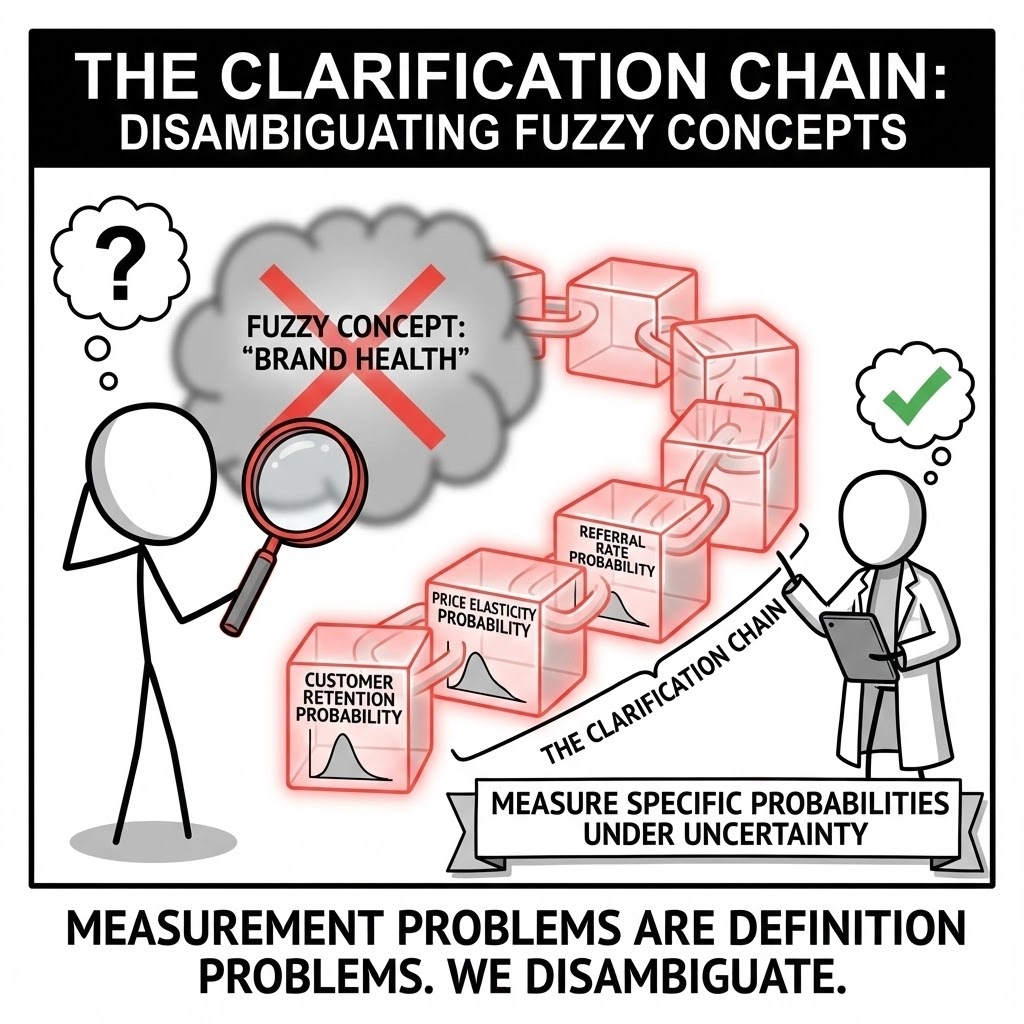
The Clarification Chain. Measurement problems are often definition problems in disguise. We rigorously "disambiguate" fuzzy concepts. We do not measure "Brand Health"; we measure the specific probabilities of customer retention, price elasticity, and referral rates under uncertainty.
The Strategic Imperative: You cannot manage what you cannot define. Executives often label risks as "Intangible" simply because they are ill-defined. We force a decomposition of vague concepts into observable states. If "Reputation Risk" matters, it must have an observable consequence (e.g., a drop in sales or an increase in capital cost). Once the consequence is defined, it is measurable.
The Failure Mode: "The Intangibility Myth." Organizations spend millions managing "Strategic Alignment" or "Culture" without ever defining the units of measure. This leads to "Management by Slogan," where resources are poured into initiatives that have no quantifiable success criteria, making ROI calculation impossible.
Practical Example: A bank wanted to measure "Cybersecurity Resilience." The concept was too fuzzy to model. We decomposed it into "Probability of a Breach >$10M" and "Mean Time to Detection." This allowed us to calculate that a $5M investment in detection software yielded a higher risk-adjusted return than a $20M firewall upgrade.
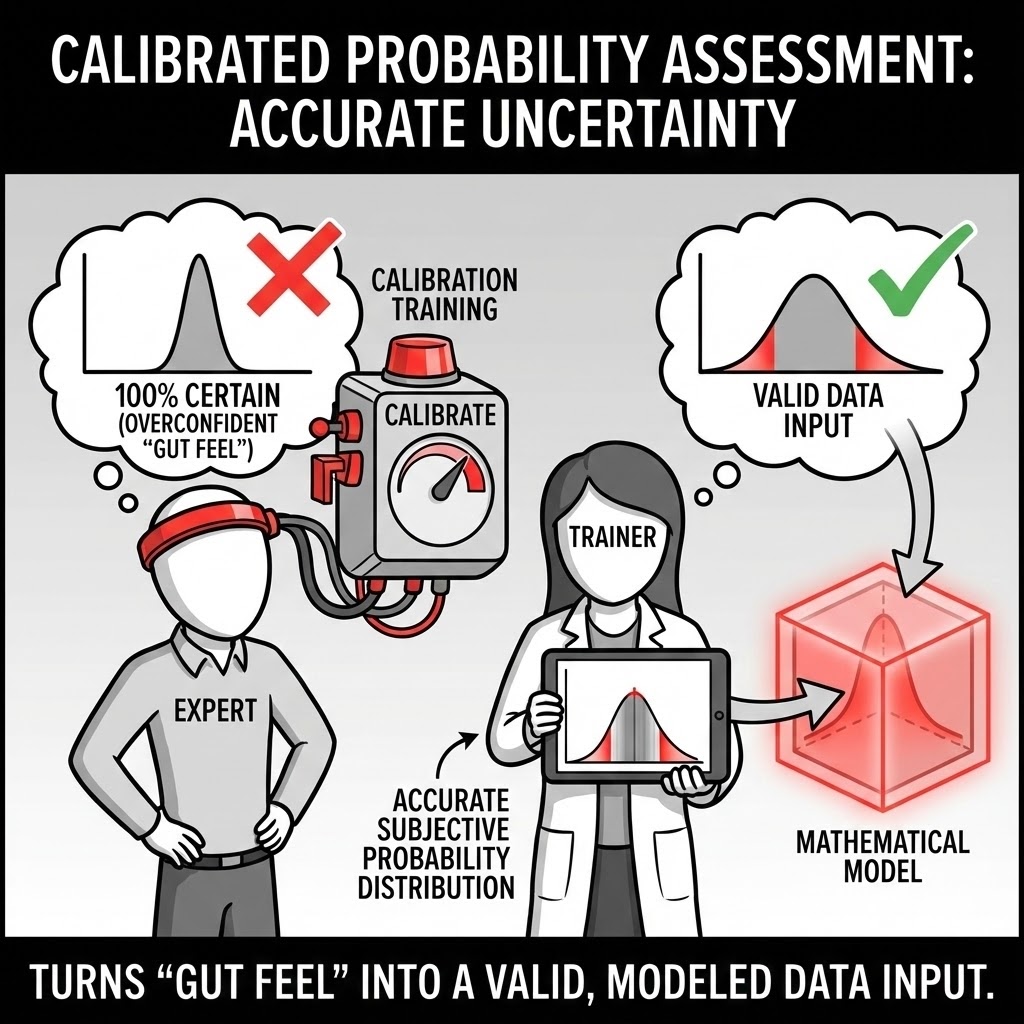
Calibrated Probability Assessment. Most experts are statistically overconfident. We train and calibrate your subject matter experts to provide subjective probability distributions that accurately reflect their uncertainty.
The Strategic Imperative: Models are garbage-in, garbage-out. The most common garbage is the overconfident expert. Research shows that when uncalibrated experts say they are "90% confident," they are usually right only 40-60% of the time. We put your experts through calibration training until their subjective "90%" statistically aligns with a 90% hit rate. This turns "gut feel" into a valid, mathematical instrument.
The Failure Mode: "The HiPPO Effect" (Highest Paid Person's Opinion). Decisions are often driven by the person who sounds the most certain, not the one who is most accurate. Without calibration, loud optimism overrides quiet accuracy, leading to systematically understated risk profiles in major projects.
Practical Example: A Geologist assured the board there was a "high chance" of finding lithium. After calibration, we revealed that "high chance" to him meant 65%, whereas the Finance Director interpreted "high chance" as 90%. This 25% gap in perception was the difference between a viable project and a value-destroying one.
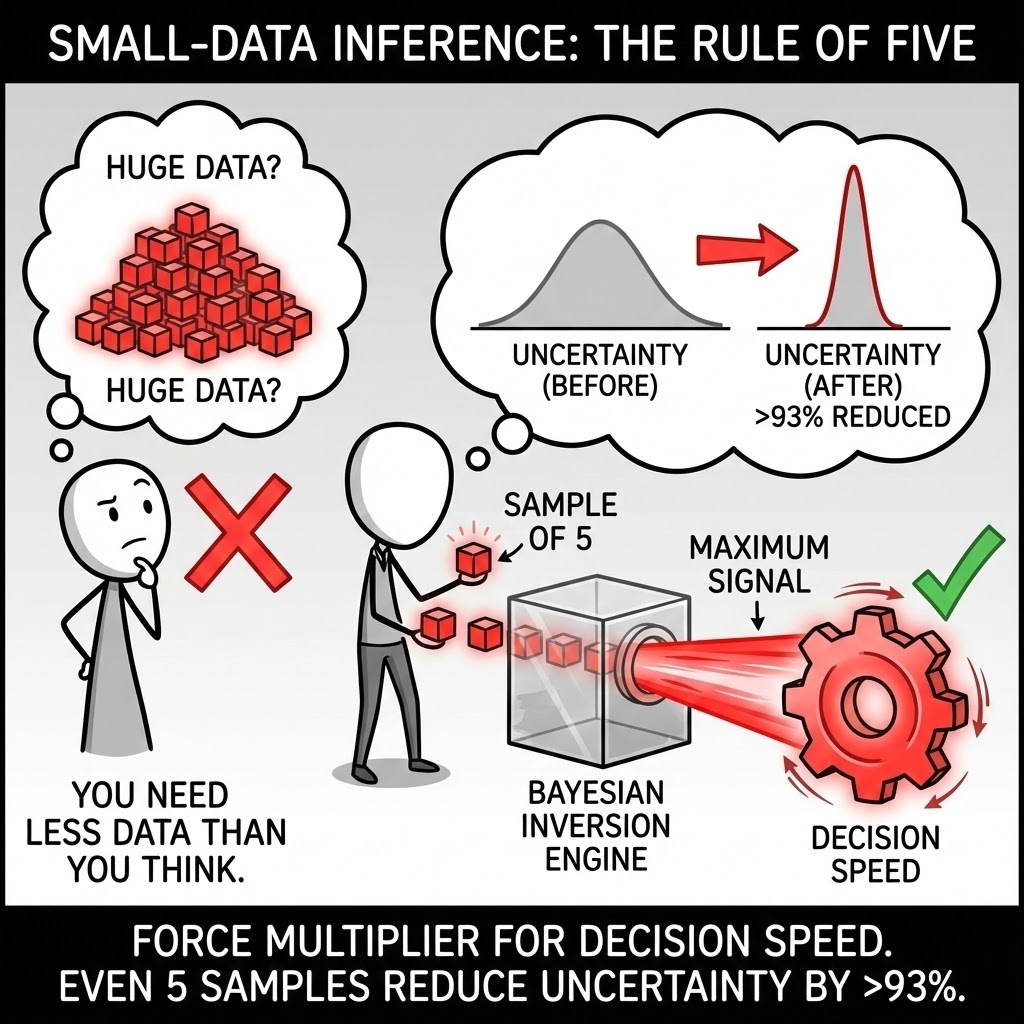
Small-Data Inference (The Rule of Five). You need less data than you think to reduce uncertainty. We utilize Bayesian inversion to extract maximum signal from sparse data. Even a sample size of five can reduce the uncertainty of a population median by over 93%.
The Strategic Imperative: In strategy, you rarely have "Big Data." You have messy, sparse data. The belief that "we don't have enough data to measure that" is a statistical fallacy. We prove mathematically that the single most valuable data point is the first one. We use Bayesian methods to update prior beliefs with very small samples, allowing for rapid decision-making while competitors are still designing the survey.
The Failure Mode: "Big Data Envy." Teams paralyze decision-making waiting for a perfect dataset (n=1000) that will take six months to collect. By the time they have "statistical significance," the market opportunity is gone. They confuse "Scientific Certainty" (required for publishing a paper) with "Economic Certainty" (required for making a bet).
Practical Example: A client delayed a product launch to survey 10,000 customers about willingness-to-pay. We showed that sampling just 12 customers reduced the uncertainty range by 96%. The pilot revealed the price point was rejected, saving the client $200k in survey costs and 3 months of delay.
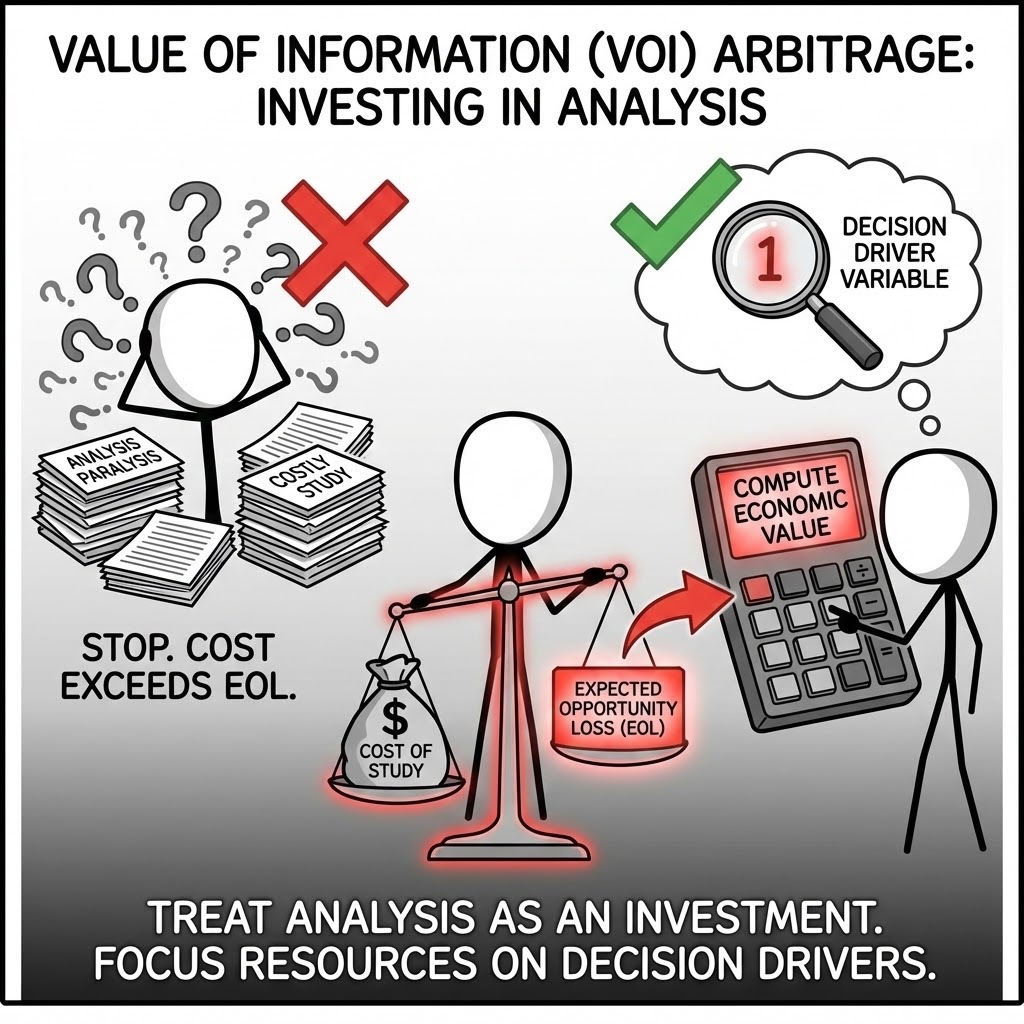
Value of Information (VOI) Arbitrage. We compute the economic value of measuring before we measure. If the cost of a study exceeds the "Expected Opportunity Loss" (EOL) of the decision, we stop. We treat analysis itself as an investment decision.
The Strategic Imperative: Curiosity is expensive; clarity is an investment. Most corporate analysis destroys value because it measures variables that don't change the decision. We calculate the "VOI" for every uncertain variable. If knowing the exact "Market Size" won't change the "Go/No-Go" decision (because the decision is robust anyway), we stop measuring it.
The Failure Mode: "Due Diligence Theater." Investment committees often demand endless studies to provide "comfort," not insight. They spend $1M investigating a risk that has a maximum impact of $500k. This is negative-NPV behavior masquerading as prudence.
Practical Example: An energy firm planned a $2M seismic study to reduce uncertainty on a reservoir. Our VOI analysis showed that even if the study came back negative, the project was still profitable. The study had zero decision value. We advised cancelling the study and drilling immediately, accelerating cash flow by 6 months.
By decomposing "impossible" measurements into a series of Fermi problems and applying Monte Carlo simulations, we prove that uncertainty is not a barrier to analysis—it is a variable to be managed.
The Mandate: Principles of Analytical Governance
We treat foresight as an analytical discipline, not a creative exercise. Rather than projecting one future, we define the space of plausible outcomes and quantify their financial and operational implications. This requires a rigorous standard of governance.
Our methodology rests on three critical principles:
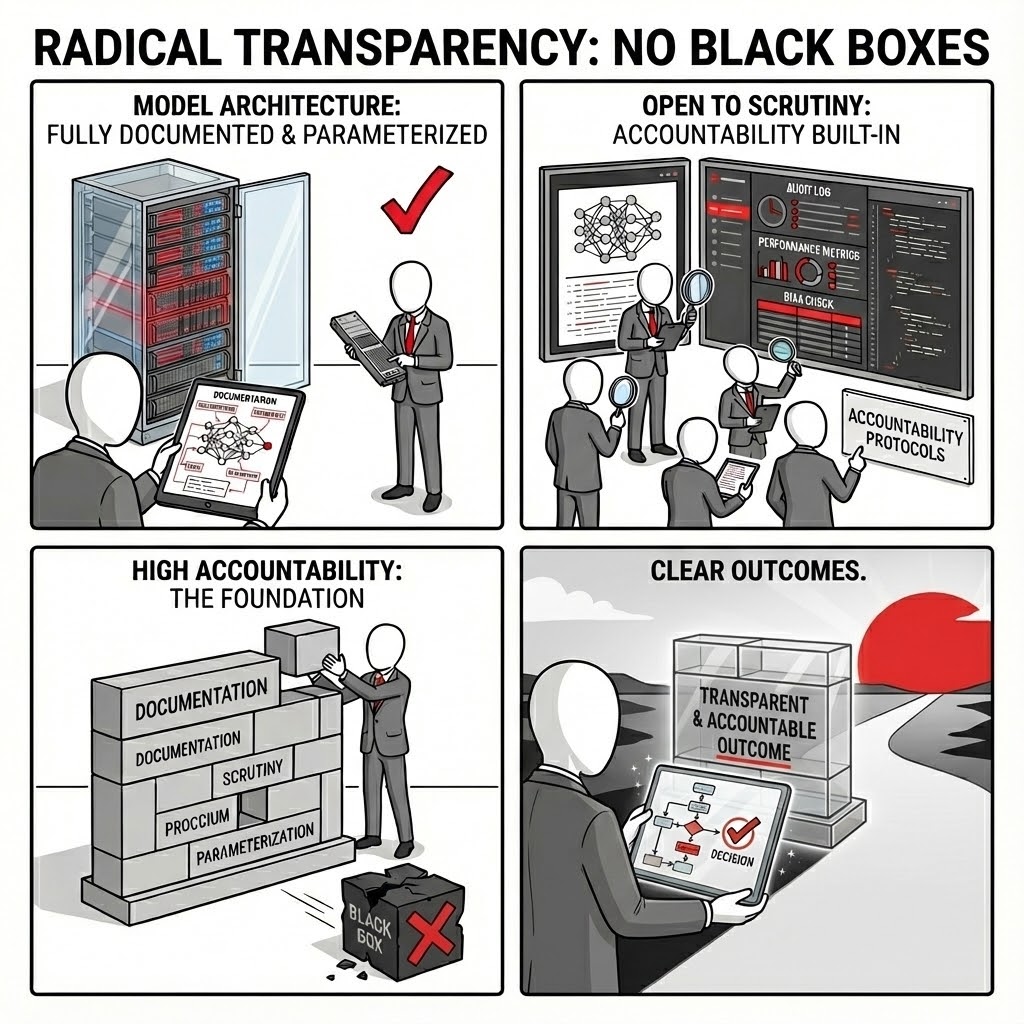
We enforce a standard of Radical Transparency. Every model is treated as a high-stakes engineering artifact—fully documented, strictly parameterised, and open to scrutiny. We eliminate "black box" algorithms, ensuring that high accountability is built into the very architecture of the logic.
A model that cannot be audited is a liability. We adhere to the philosophy that code is law: if the logic isn't explicit, it doesn't exist. By separating data from calculation and enforcing strict version control, we ensure that the provenance of every number—from input assumption to final cash flow—is traceable and defensible.
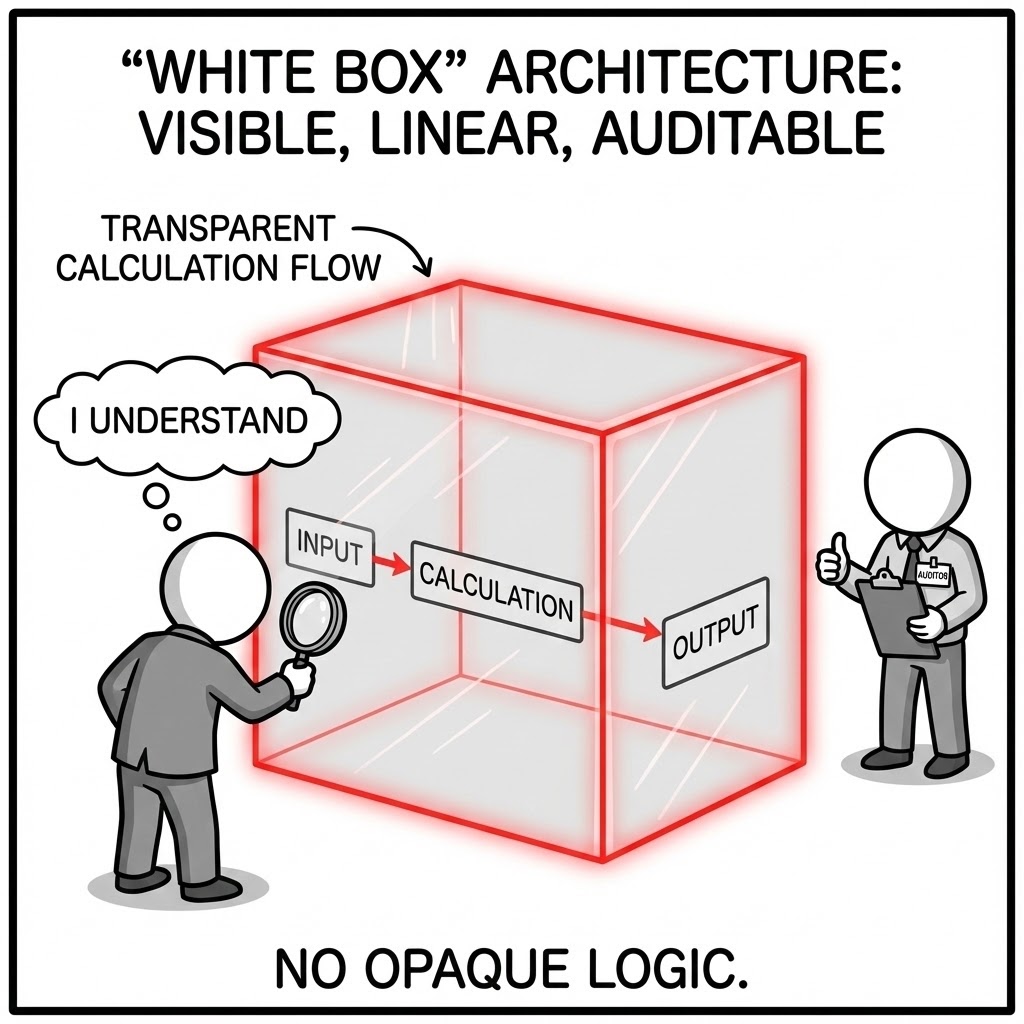
"White Box" Architecture. We reject compiled, opaque logic. We deliver models where the calculation flow is visible, linear, and understandable to third-party auditors and technical due diligence teams.
The Strategic Imperative: In project finance, model opacity is treated as a risk premium. If a lender’s technical advisor cannot trace the logic from assumption to cash flow in minutes, they assume the worst. "White Box" design removes the friction of due diligence, turning the model from a liability into a transparent asset that accelerates financial close.
The Failure Mode: Complex macros and hidden VBA scripts often mask calculation errors that only surface during stress tests. When a model acts as a "Black Box," stakeholders lose trust the moment a counter-intuitive result appears, often stalling negotiations indefinitely.
Practical Example: An infrastructure fund recently rejected a renewable energy acquisition because the seller’s model used compiled code to calculate tax credits. Unable to independently verify the tax logic during the committee meeting, the risk committee simply declined the deal rather than delay.
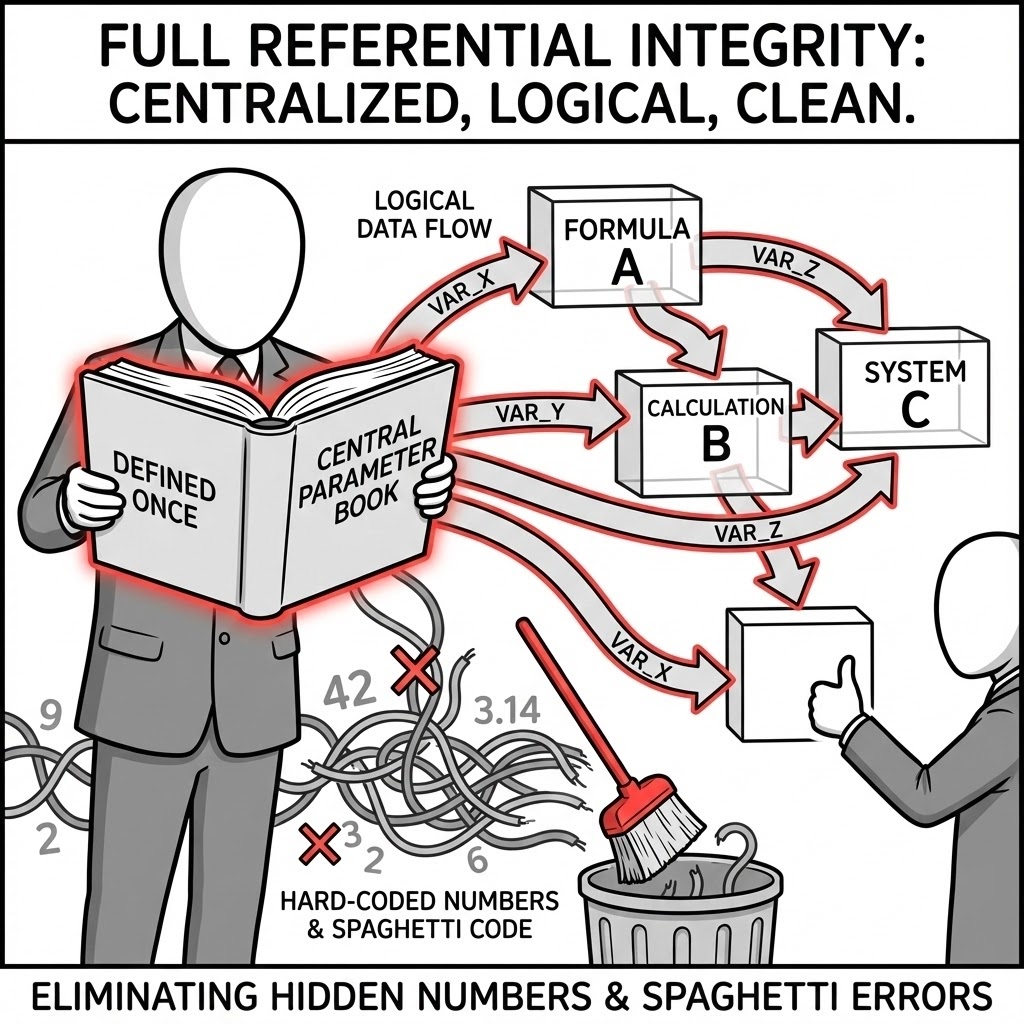
Full Referential Integrity. We ensure that no "hard-coded" numbers hide in formulas. Every variable is defined once in a central parameter book and flows logically through the system, eliminating "spaghetti code" errors.
The Strategic Imperative: A financial model must be a single system of truth. Integrity means that a change in a single input cell (e.g., inflation rate) instantly and correctly propagates through every schedule—OPEX, debt service, tax, and returns—without manual intervention. This allows for rapid, confident scenario planning during live negotiations.
The Failure Mode: "Hard-coding"—typing a number like
*1.02directly into a formula—is the silent killer of valuation. When assumptions change, these hidden numbers remain fixed, creating invisible errors that compound over the project lifecycle.Practical Example: A mining major discovered post-FID that their approved CAPEX budget was understated by $45M. A junior analyst had hard-coded a "temporary" transport cost in a sub-calculation tab, which failed to update when fuel price assumptions were revised globally.
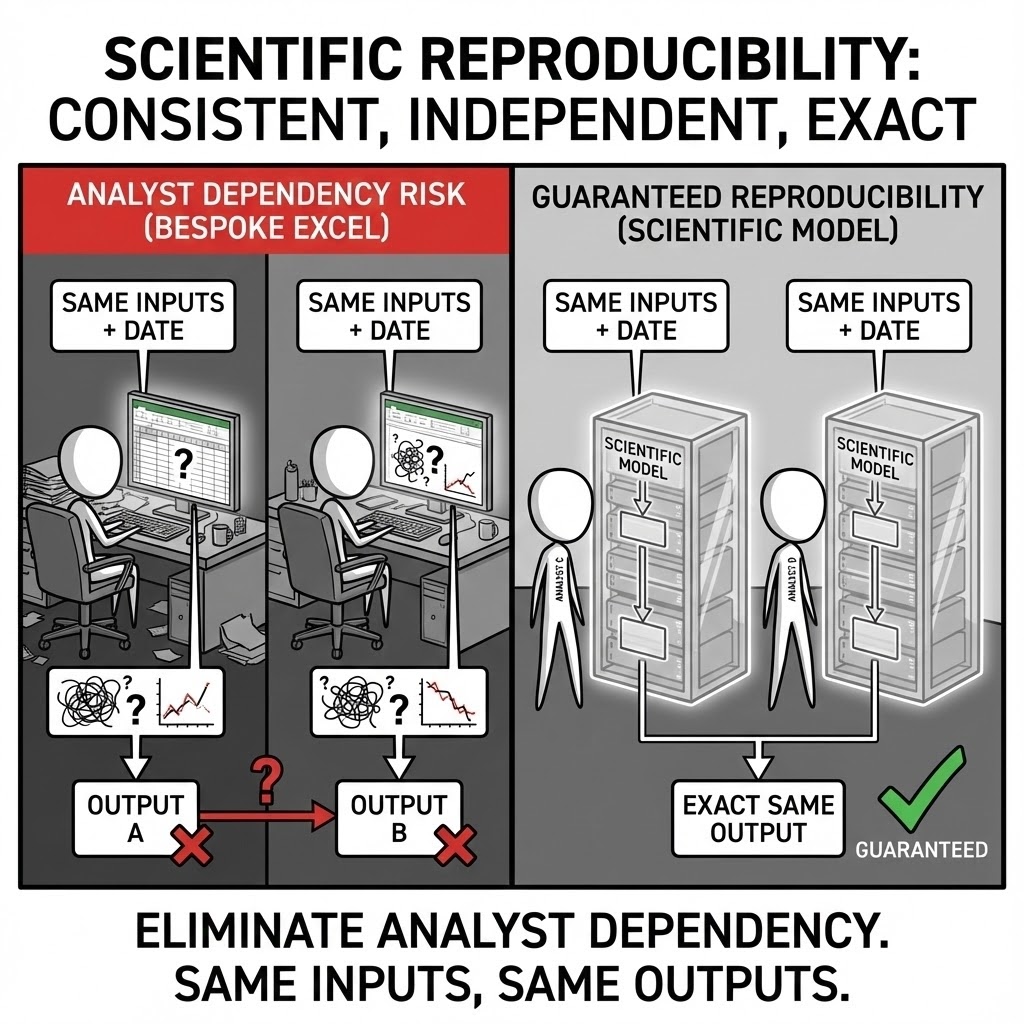
Scientific Reproducibility. We guarantee that any analyst, given the same inputs and the same date, will generate the exact same outputs. We eliminate the "analyst dependency" risk common in bespoke Excel models.
The Strategic Imperative: Industrial assets live for decades; analysts do not. A robust model must be transferrable intellectual property, not a personal artifact. Reproducibility ensures that the logic is deterministic and stable, allowing new teams to take ownership without forensic reverse-engineering.
The Failure Mode: Models often rely on the specific configuration of the author's laptop or undocumented manual steps (e.g., "Goal Seek must be run twice"). When the original author leaves, the model becomes a "frozen" artifact that the organization is afraid to touch, rendering it useless for future decision-making.
Practical Example: A utility company failed to hedge its gas exposure in time because their pricing model crashed whenever the "Date" setting was changed. The model relied on a deprecated plugin installed only on the former CFO’s laptop.
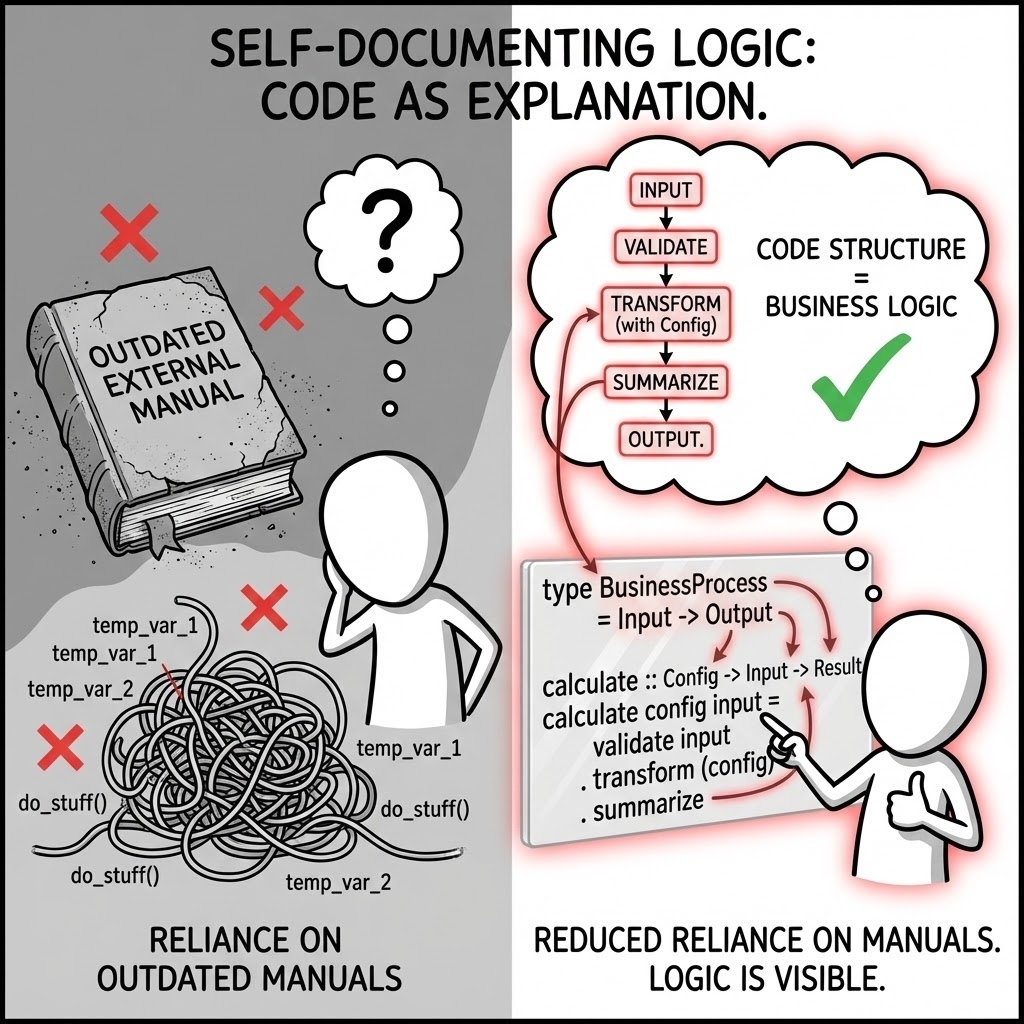
Self-Documenting Logic. We utilize functional programming principles where the code structure itself explains the business logic, reducing the reliance on external, often outdated, manuals.
The Strategic Imperative: In high-stakes environments, external documentation is rarely read and almost never up to date. We structure formulas using named ranges and clear logical steps (e.g.,
Revenue = Price * Volumerather than=D5*E5). The logic communicates its intent directly to the user.The Failure Mode: "Excel Archaeology." When logic is obscure, errors are assumed to be features. Future users, unable to decipher the intent of a complex nested formula, will often build "patches" on top of it, creating layers of technical debt that eventually collapse the model.
Practical Example: During a tax audit, a renewable developer was fined for misallocating depreciation. The error lay in a complex, undocumented
IF/THENstatement written three years prior that no one understood, so no one corrected it when tax laws changed.
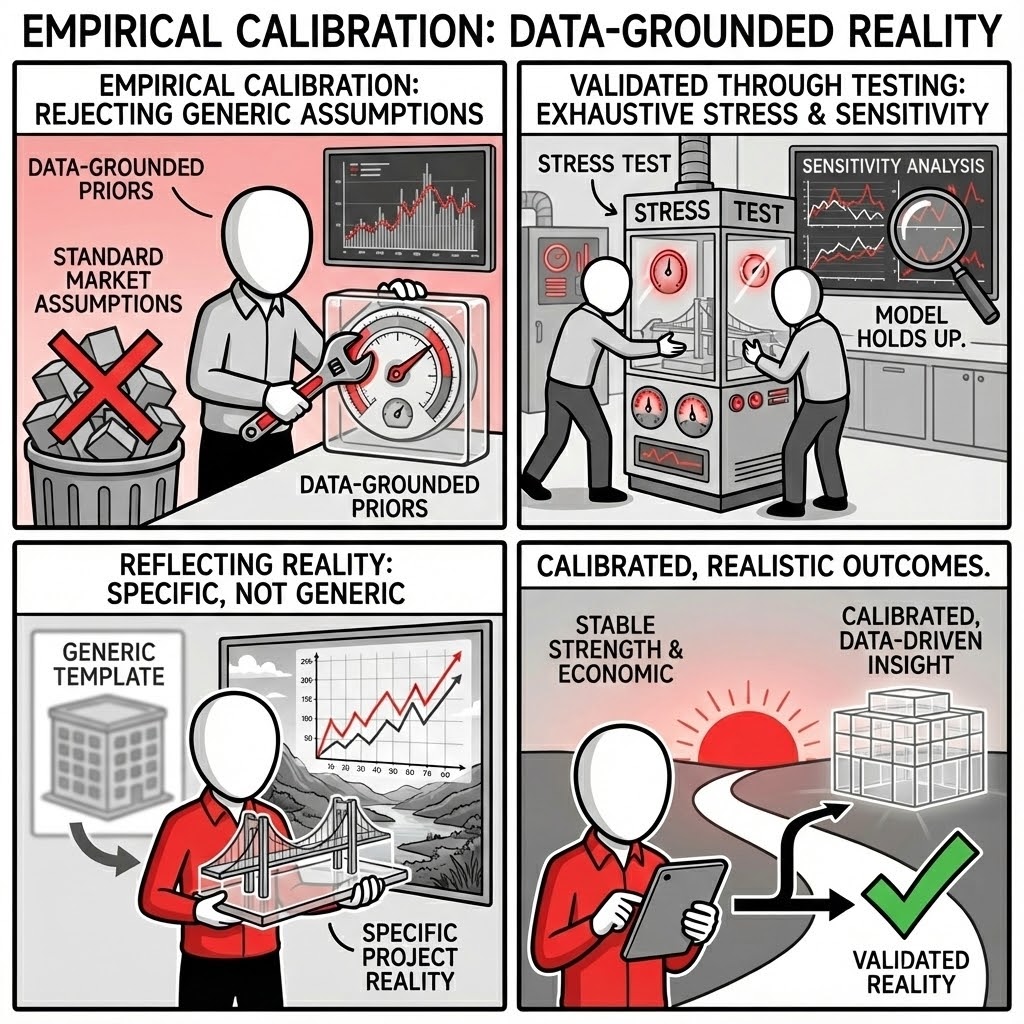
We adhere to strict Empirical Calibration. We reject "standard market assumptions" in favor of specific, data-grounded priors. Each assumption is validated through exhaustive sensitivity and stress testing, ensuring the model reflects the physical and economic reality of the specific project, not a generic template.
Models are often precise but rarely accurate. We bridge this gap by grounding our inputs in observed history and rigorous statistical estimation. We treat assumptions as hypotheses to be tested, not constants to be accepted. This involves a continuous loop of backtesting against historical data to verify that the model's behavior matches reality.
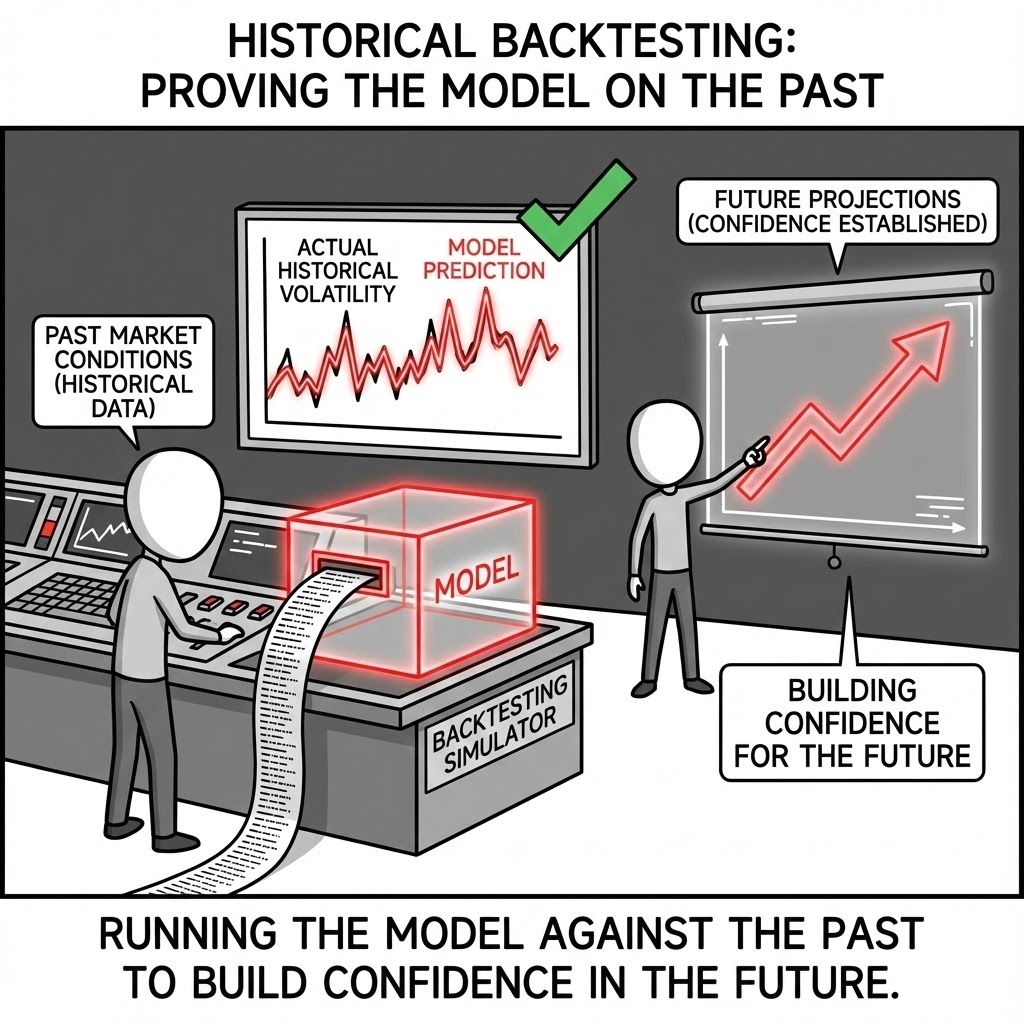
Historical Backtesting. We run the model against past market conditions to prove it would have correctly predicted historical volatility, establishing confidence in its future projections.
The Strategic Imperative: A financial model is a hypothesis about how a business reacts to the world. If that hypothesis cannot accurately simulate the past, it has no business predicting the future. We force the model to "live through" historical crises (e.g., the 2008 crash, the 2020 pandemic) to verify that its cash flow logic reacts realistically to stress.
The Failure Mode: "Curve Fitting." Analysts often tune a model to look smooth under "steady state" assumptions. When reality hits—and correlations shift (e.g., gas prices rising while demand falls)—these fair-weather models break, usually leading to liquidity crises that management never saw coming.
Practical Example: A commodities trader engaged us to review a proprietary trading algorithm. By backtesting it against the 2021 energy crisis, we demonstrated that the model’s "stop-loss" logic would have triggered three days too late, technically bankrupting the desk before the hedge could execute.
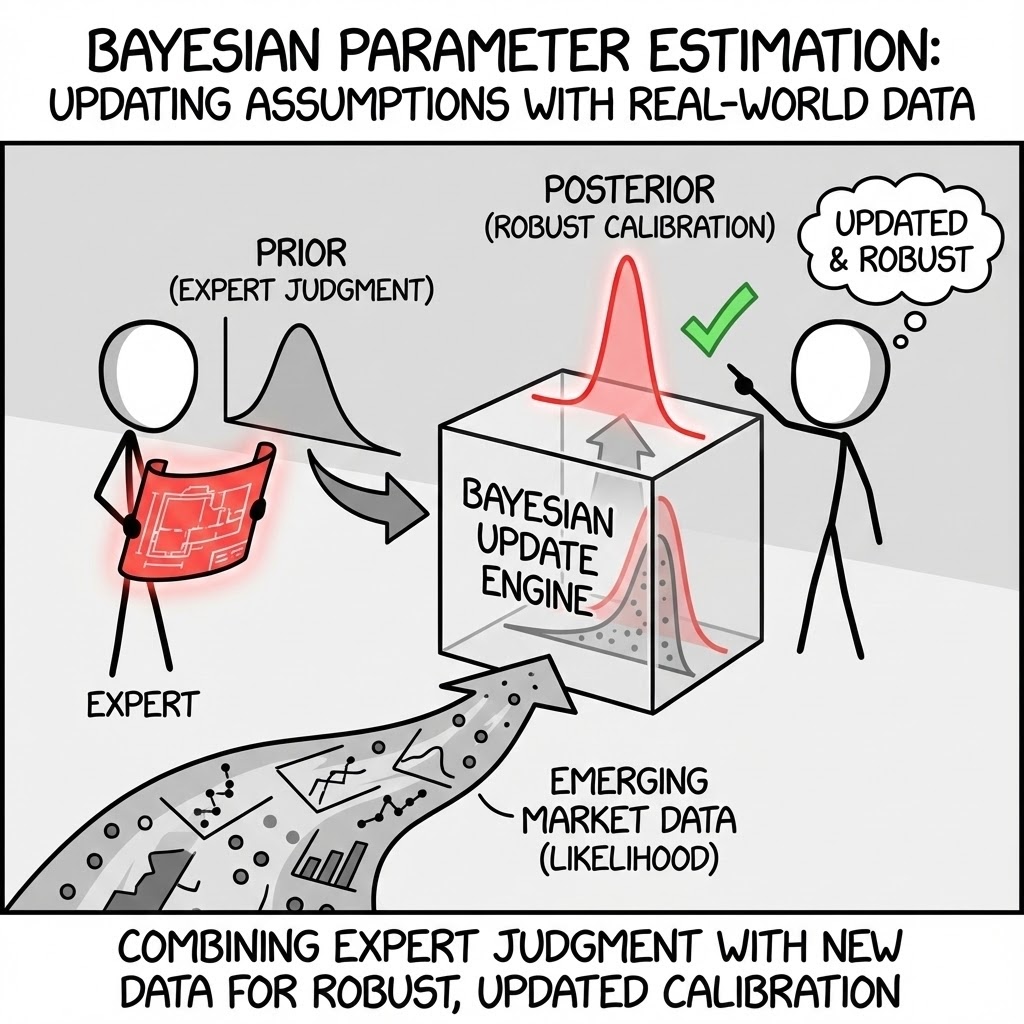
Bayesian Parameter Estimation. We use this to update assumptions as new real-world data arrives, combining expert engineering judgment (priors) with emerging market data (likelihood) for robust calibration.
The Strategic Imperative: In greenfield projects, initial data is scarce. We cannot wait for "perfect" statistical significance. Bayesian methods allow us to scientifically blend the Engineering Feasibility Study (the "Prior") with early operational data (the "Likelihood"). This creates a learning model that becomes more accurate with every week of operations.
The Failure Mode: "Anchoring Bias." Project teams often cling to the optimistic assumptions made at the Final Investment Decision (FID) long after reality has shifted. Without a mathematical framework to update beliefs, management ignores early warning signals, treating them as outliers rather than the new normal.
Practical Example: A mineral processing plant was underperforming on recovery rates. Management blamed "bad batches." Our Bayesian analysis of the first 40 production runs proved mathematically that the underlying process capability was 8% lower than the FID model, forcing an immediate—and necessary—restructuring of the debt facility.
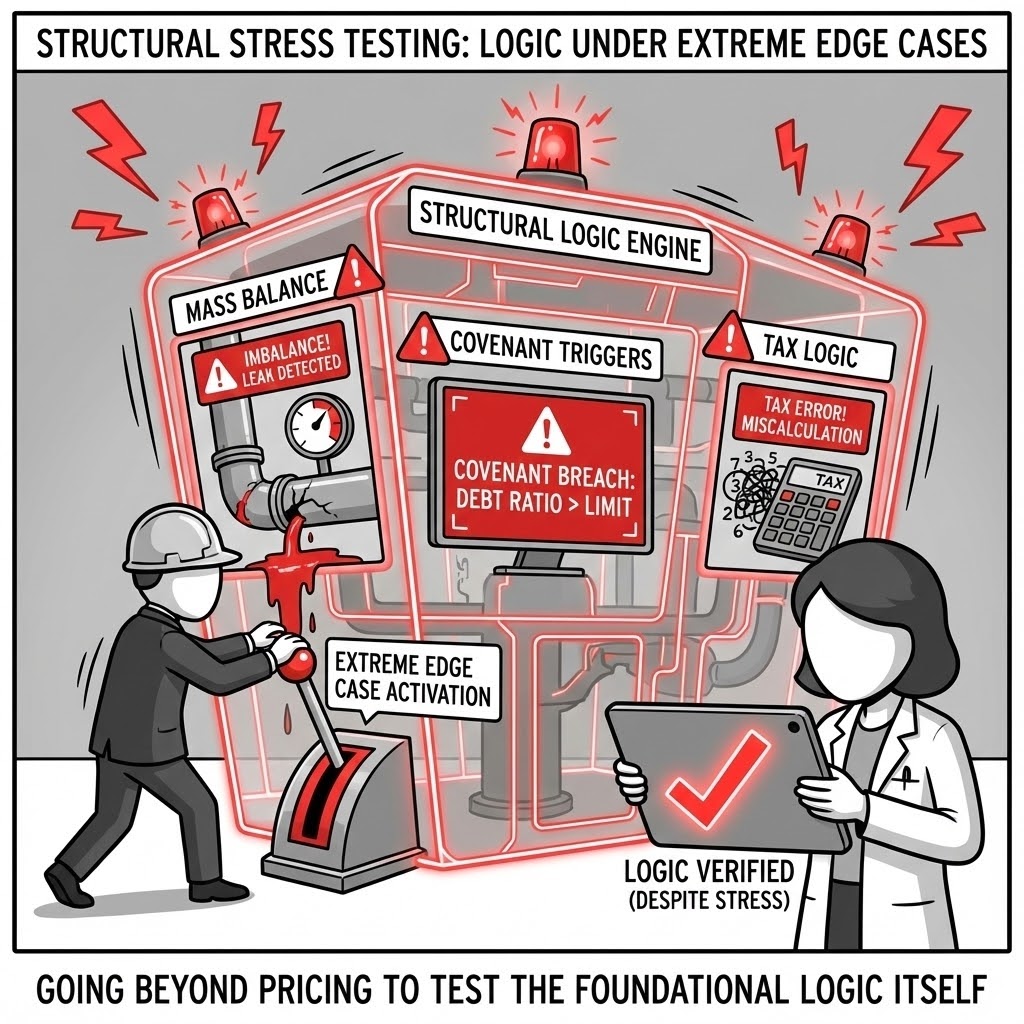
Structural Stress Testing. We go beyond pricing checks to test the logic itself. We verify that mass balances hold, covenants trigger correctly, and tax logic applies accurately under extreme edge cases.
The Strategic Imperative: Standard sensitivity analysis (±10% on price) is insufficient. We "break" the model to ensure it obeys the laws of physics and contract law. Does the model prevent you from selling more tons than you produced? Does the tax logic handle carry-forwards correctly when revenue drops to zero? If the model survives the extremes, it is safe for the average.
The Failure Mode: "Linear Extrapolation." Many models simply multiply Price × Volume, ignoring the non-linear cliffs. They fail to capture the "Death Spiral"—where low revenue triggers a covenant breach, which triggers a sweep of cash, which prevents maintenance, which further lowers revenue.
Practical Example: We audited a hydrogen project where the model looked profitable even at low electricity prices. Stress testing revealed a fatal flaw: the model allowed the electrolyzer to run at 110% capacity during cheap power intervals—violating the physical mass balance of the plant equipment.
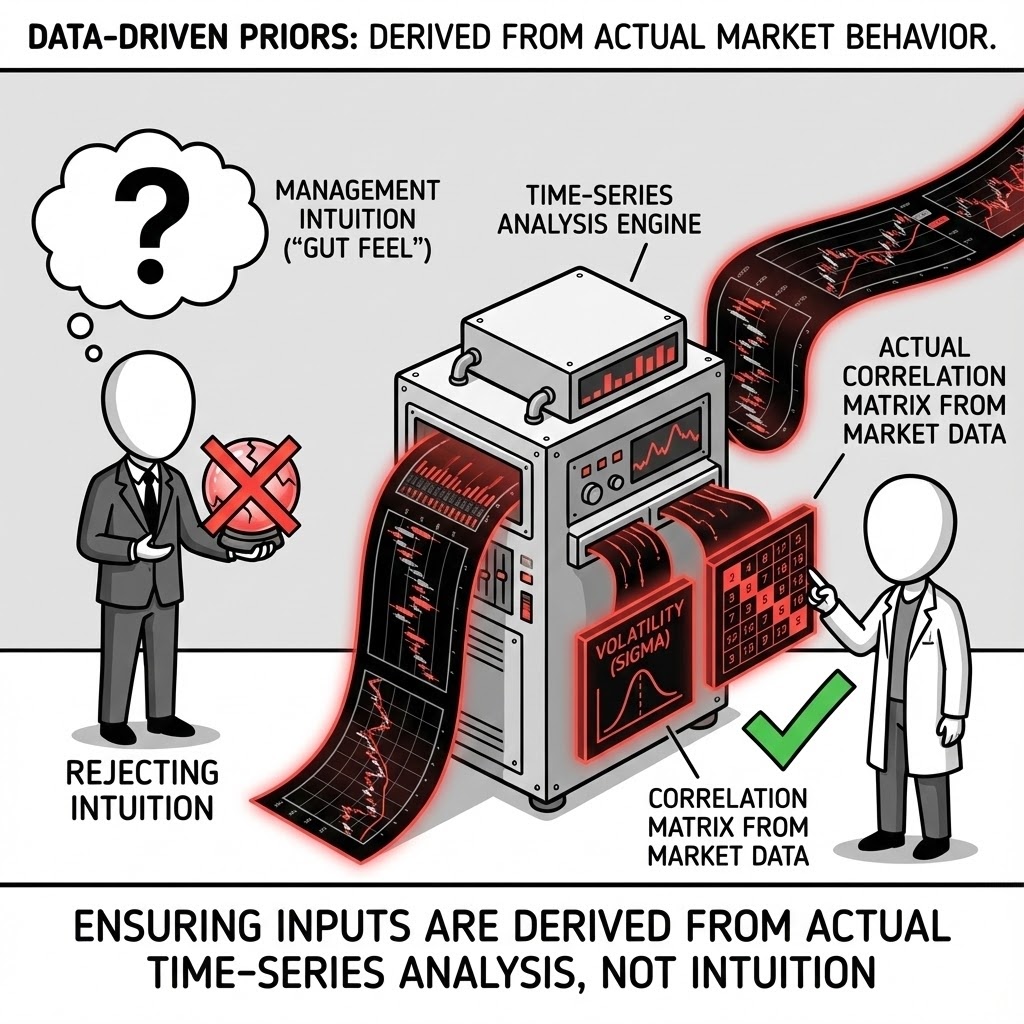
Data-Driven Priors. We ensure that volatility inputs (sigma) and correlation matrices are derived from time-series analysis of actual market behavior, not management intuition.
The Strategic Imperative: Humans are biologically wired to underestimate risk (Optimism Bias). Management teams consistently predict narrower price bands than history dictates. We replace "gut feel" inputs with empirically derived volatility surfaces, ensuring that contingency funds and hedging strategies are sized for the real world, not the hoped-for world.
The Failure Mode: "The Flaw of Averages." Using an average historical price in a volatile market is dangerous. If you model a battery metal project using average volatility, you will underestimate the liquidity required to survive a standard market dip, leading to a cash crunch just as the market turns.
Practical Example: A board was preparing to self-insure a logistics chain based on a "1-in-100 year" risk estimate from their logistics director. Our analysis of 50 years of shipping data showed the event was actually a "1-in-12 year" occurrence, prompting the board to purchase external insurance immediately.
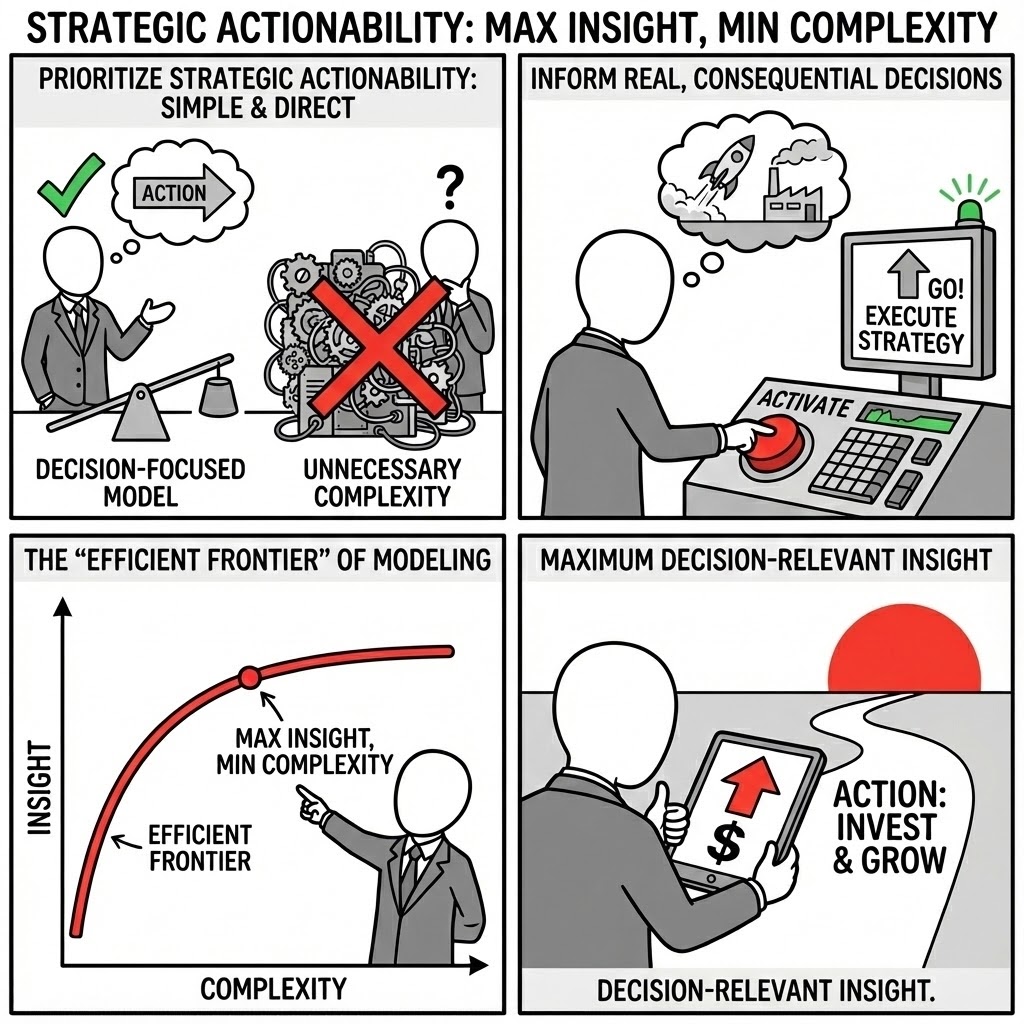
We prioritize Strategic Actionability above all. Models are designed to inform real, consequential decisions—not to impress with unnecessary complexity. We focus on the "Efficient Frontier" of modeling: delivering the maximum amount of decision-relevant insight with the minimum viable complexity.
A model is a tool for decision-making, not a science experiment. We avoid "Analysis Paralysis" by focusing relentlessly on the variables that actually move the needle. Our output is designed for the Boardroom: clear, binary decision boundaries, quantified trade-offs, and an unambiguous view of the risk-reward landscape.
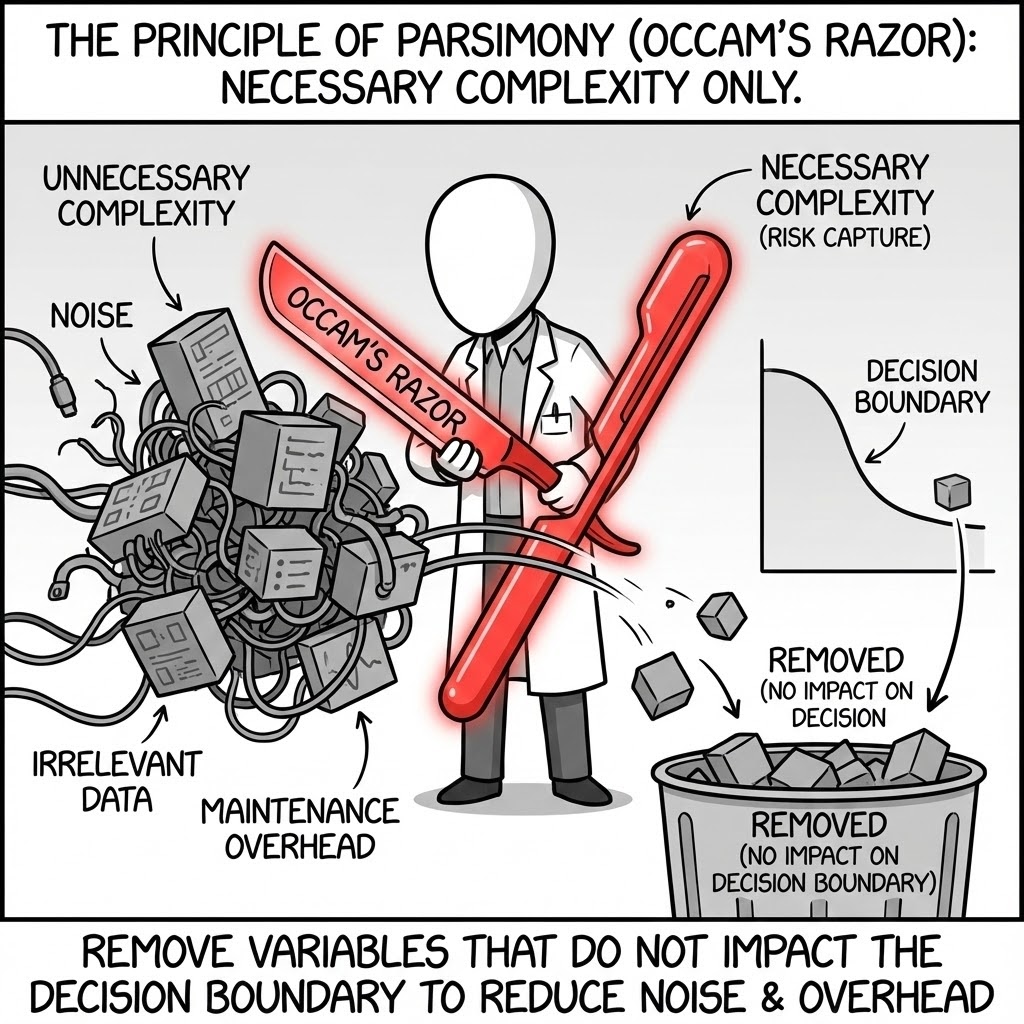
The Principle of Parsimony (Occam’s Razor). We include only the complexity necessary to capture the risk. If a variable does not impact the decision boundary, it is removed to reduce noise and maintenance overhead.
The Strategic Imperative: Complexity is a form of technical debt. Every unnecessary variable increases the probability of error and the cost of audit. We rigorously apply sensitivity analysis to strip away "noise" variables. If a 50% change in a cost driver shifts the NPV by less than 1%, it does not belong in the executive model.
The Failure Mode: "Spurious Precision." Analysts often model granular details (e.g., individual office supplies or monthly travel budgets for 20 years) while hard-coding the single most important variable (e.g., the discount rate). This creates a dangerous illusion of accuracy while missing the macro-risks that actually matter.
Practical Example: A mining client’s feasibility model was crashing repeatedly due to a 50,000-row tab calculating individual tire wear for trucks. We replaced it with a single stochastic "wear-rate" driver that was mathematically identical for valuation purposes but improved calculation speed by 90%.
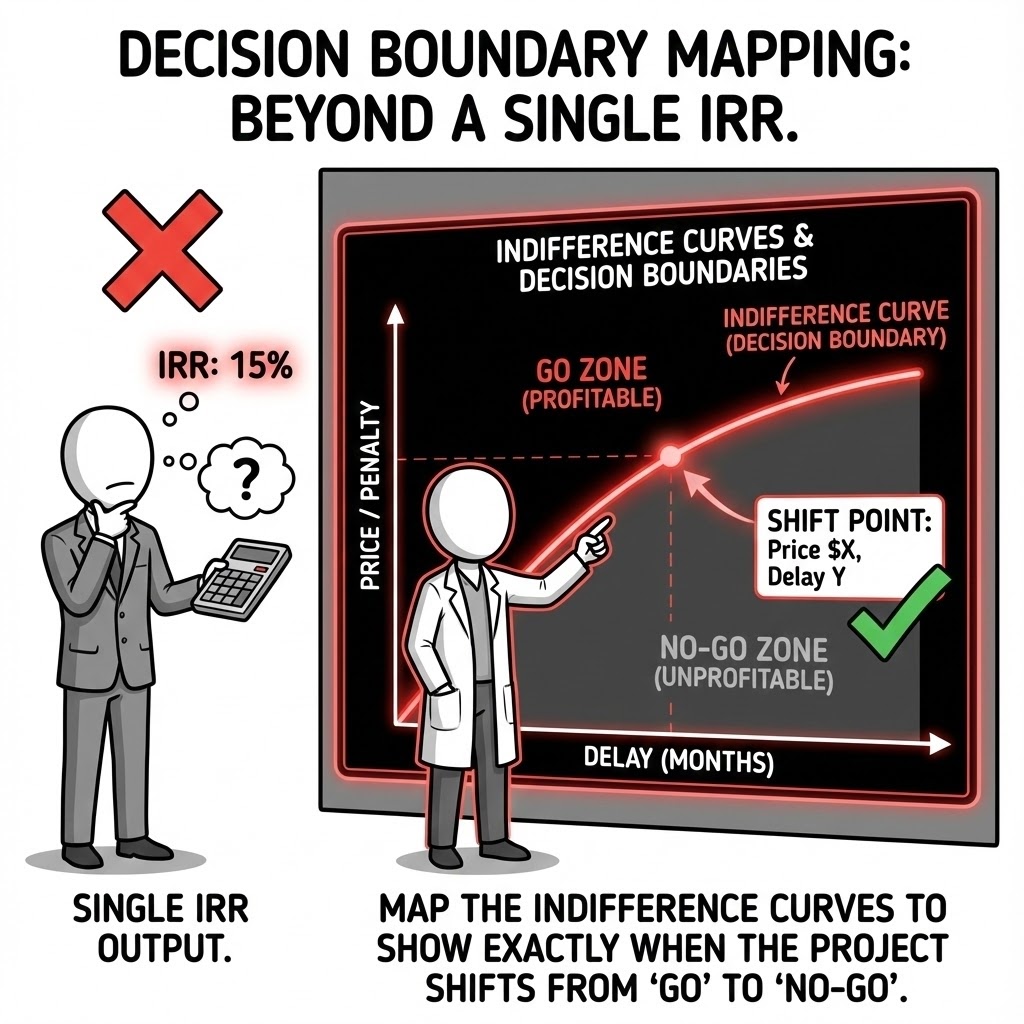
Decision Boundary Mapping. We don't just output an IRR; we map the "Indifference Curves"—showing exactly at what price, penalty, or delay the project shifts from "Go" to "No-Go."
The Strategic Imperative: Boards do not need a single number; they need to know the "Safety Margin." We invert the analysis: instead of asking "What is the IRR?", we ask "How low can the price drop before we destroy value?" This defines the "Kill Zone" for the project—a clear, monitorable threshold for governance.
The Failure Mode: "Point-Forecast Delusion." Presenting a Base Case NPV of $100M implies a certainty that does not exist. If that NPV turns negative with a mere 3-month construction delay, the project is fragile despite the high headline number. Standard models hide this fragility; Boundary Mapping exposes it.
Practical Example: An offshore wind consortium was debating a bid price. By mapping the decision boundary, we showed that while the project was robust to CAPEX inflation, it broke immediately if grid connection was delayed by more than 6 months—shifting the negotiation focus entirely to penalty clauses.
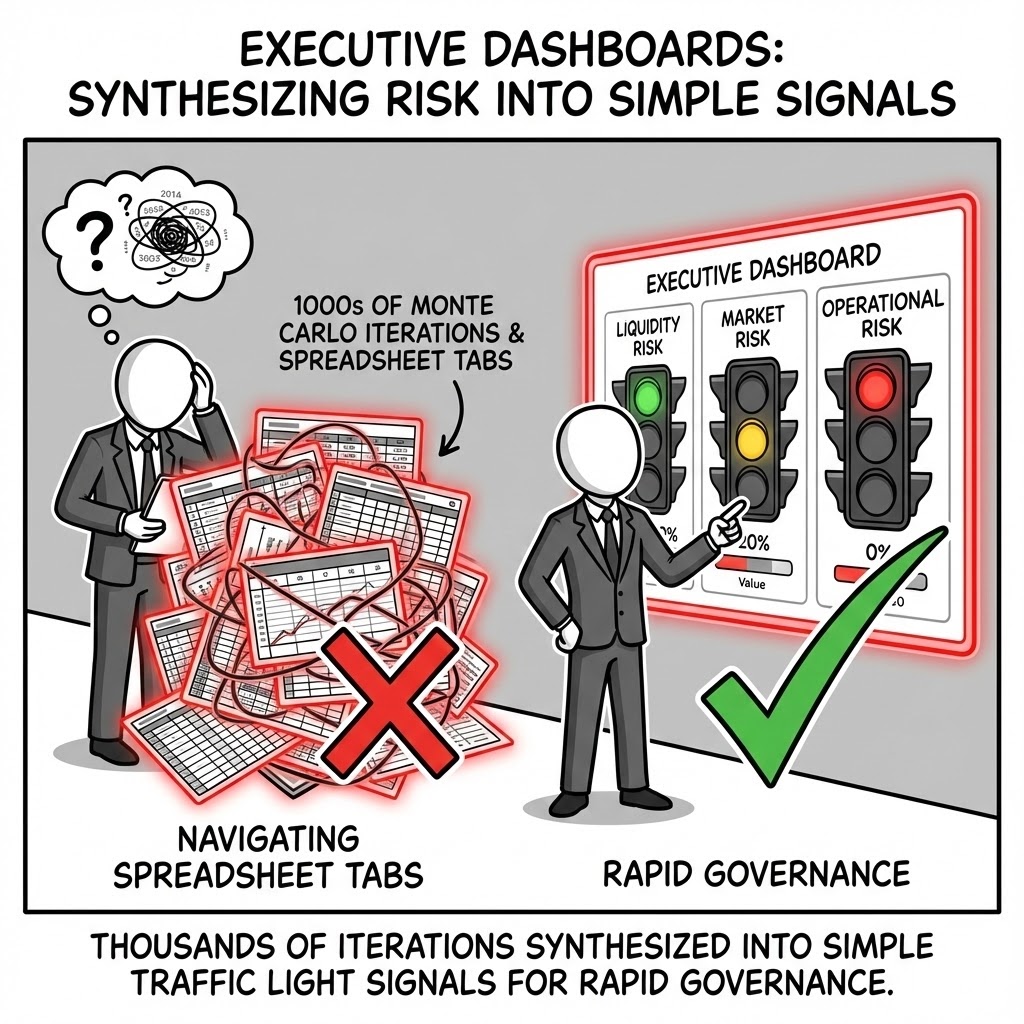
Executive Dashboards. We synthesize thousands of Monte Carlo iterations into simple "Traffic Light" signals for key risk indicators, enabling rapid governance without navigating spreadsheet tabs.
The Strategic Imperative: Executive attention is a scarce resource. A financial model must be a communication tool, not just a calculator. We design "Cockpit Views" that aggregate complex stochastic data into binary signals: Red (Action Required), Amber (Monitor), Green (Proceed). This allows the Steering Committee to govern by exception rather than getting lost in the details.
The Failure Mode: "Data Asphyxiation." Sending a 50MB Excel file to a Board member guarantees it will not be reviewed properly. Critical risks buried in "Tab 42" are missed, and decisions are made based on the Executive Summary slide, which often contradicts the model's actual findings.
Practical Example: For a portfolio of distressed assets, we built a dashboard that automatically turned the "Liquidity" indicator red if the probability of a covenant breach in the next 12 months exceeded 5%. This allowed the CFO to preemptively restructure debt before a technical default occurred.
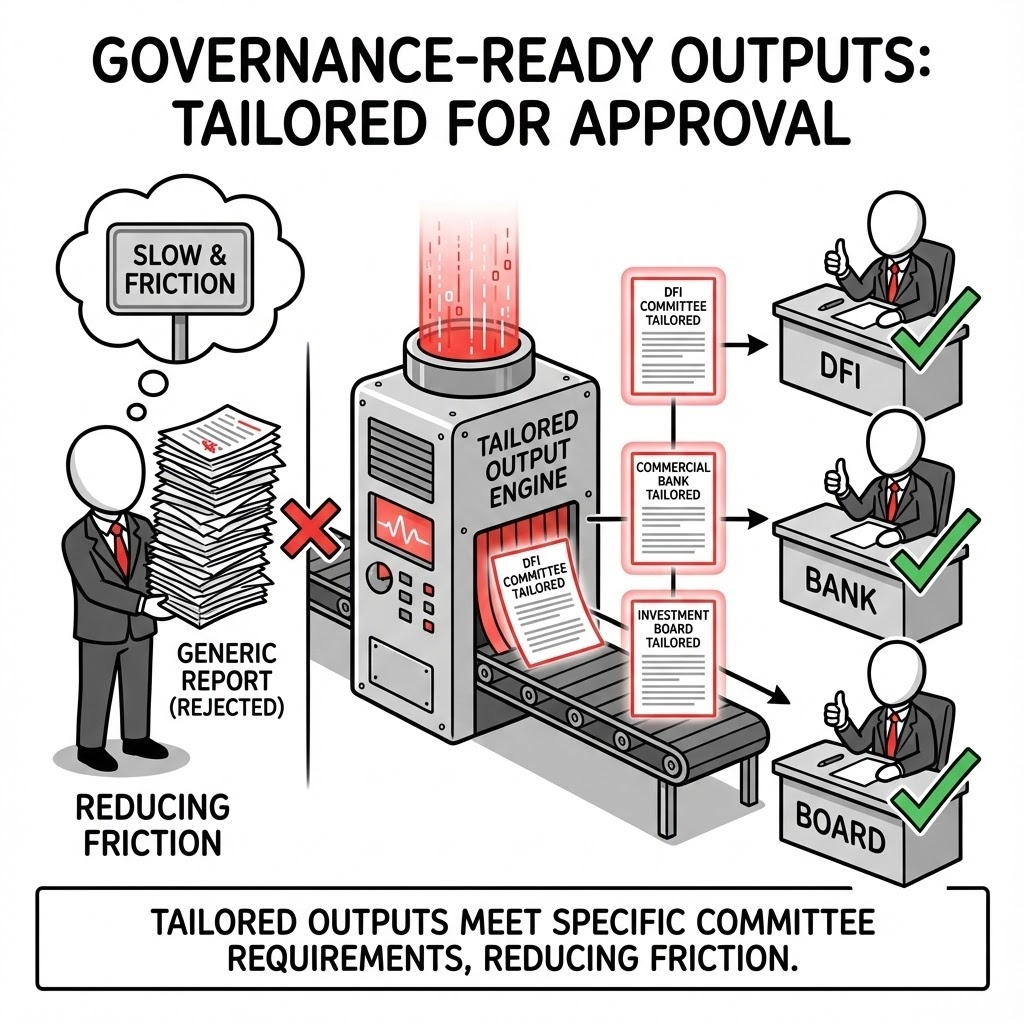
Governance-Ready Outputs. We tailor outputs to meet the specific credit committee requirements of DFIs, Commercial Banks, and Investment Boards, reducing the friction of the approval process.
The Strategic Imperative: Different capital providers speak different dialects. Equity asks about IRR and Multiples; Debt asks about DSCR, LLCR, and Tail-risk. A generic model fails both. We build automated "Lender Sheets" that rigorously calculate coverage ratios exactly as defined in the term sheet, preventing translation errors during due diligence.
The Failure Mode: "Definition Drift." A project can be rejected because the model calculates EBITDA differently than the bank's credit policy requires. This friction adds weeks to the financing timeline and erodes credibility with lenders.
Practical Example: A client seeking IFC (World Bank) funding was struggling with approval. We re-architected their model outputs to explicitly align with the "Equator Principles" reporting standards, allowing the credit committee to check their boxes immediately and unlocking the funding tranche within 14 days.
The Execution: Converting Uncertainty into Structured Insight
We support industrial and financial decision-makers in translating uncertainty into structured insight through four functional domains:
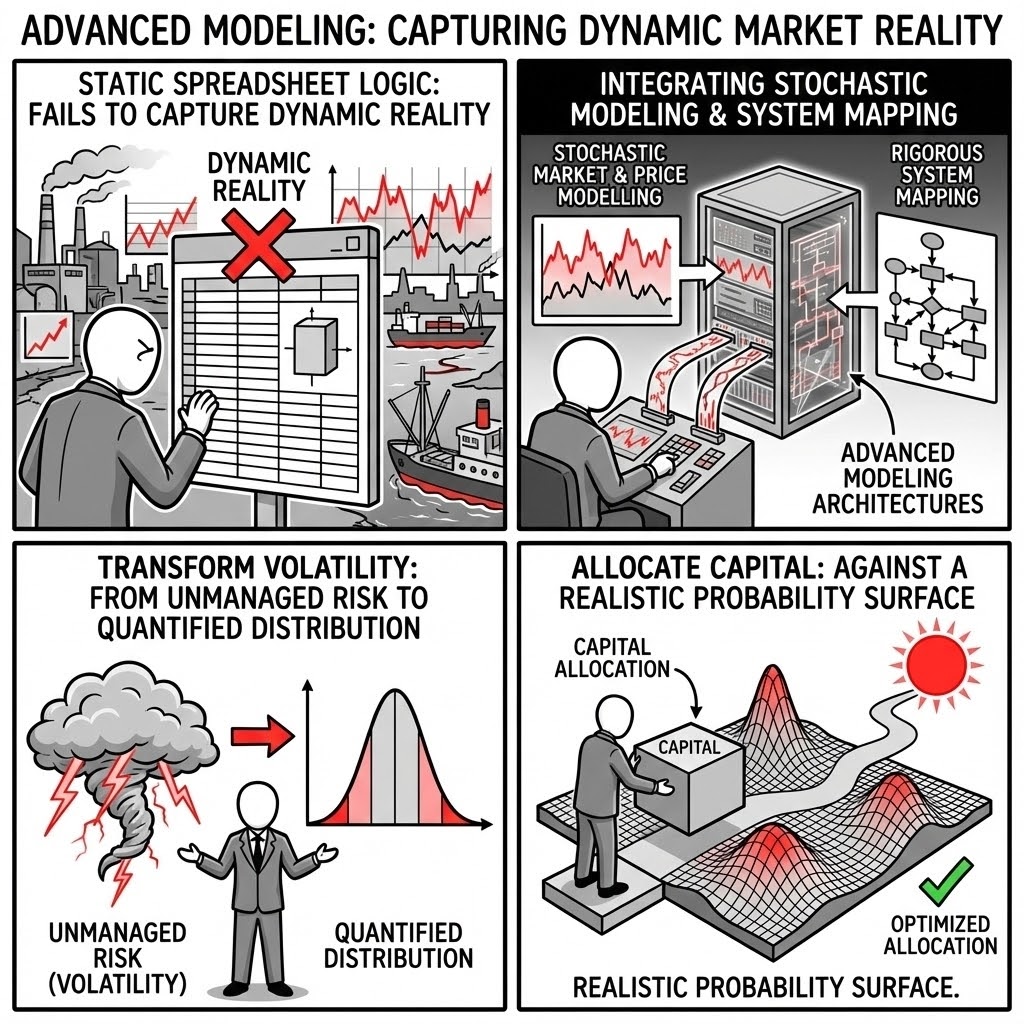
We deploy Advanced Modeling architectures that move beyond static spreadsheet logic to capture the dynamic reality of industrial markets. By integrating Stochastic Market and Price Modelling with rigorous System Mapping, we transform volatility from an unmanaged risk into a quantified distribution, allowing capital to be allocated against a realistic probability surface.
Standard financial models often fail because they assume linearity in a non-linear world. Proccium leverages high-performance computational frameworks to model the "joint dynamics" of the system—ensuring that the mathematical relationships between energy prices, inflation, and technical performance are preserved under stress.
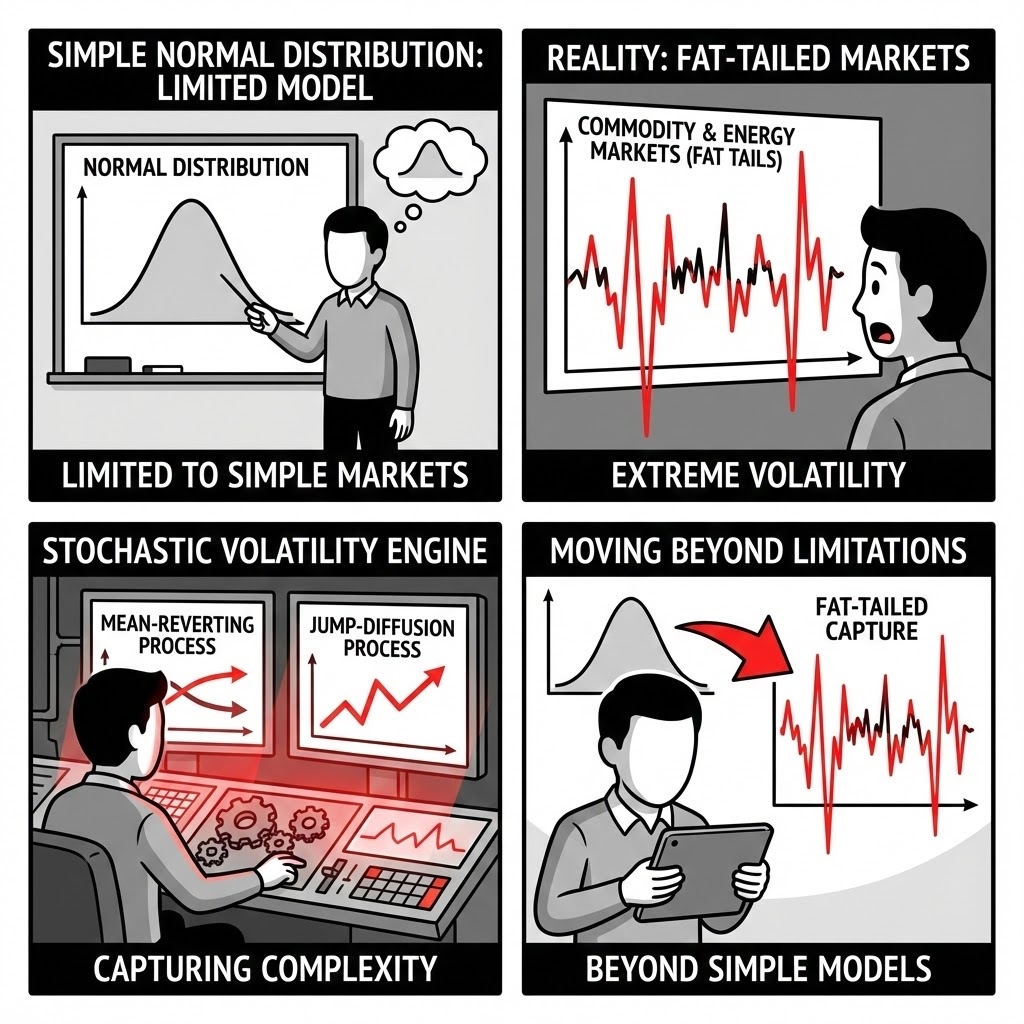
Stochastic Volatility Engines. We utilize mean-reverting and jump-diffusion processes to capture the fat-tailed nature of commodity and energy markets, moving far beyond the limitations of simple normal distributions.
The Strategic Imperative: Energy and commodity markets do not follow a bell curve; they are characterized by long periods of calm punctuated by violent, extreme spikes ("Jumps"). Standard financial models using Gaussian distributions underestimate these extremes by orders of magnitude. We model the "Fat Tails" to ensure your capital structure can survive the 1-in-20-year shock that actually happens every 5 years.
The Failure Mode: "The Sigma Trap." A standard model might predict that a 300% electricity price spike is a "6-sigma event" (mathematically impossible). In reality, in markets like ERCOT or the EU, this happens annually. If your liquidity buffer is sized on the standard model, the project defaults during the very volatility it was meant to exploit.
Practical Example: An energy storage developer modeled revenue based on average daily price spreads. We implemented a jump-diffusion model that captured rare but extreme price spikes. The result showed that 60% of the project's free cash flow came from just 40 hours of operation per year—radically changing the operational strategy.
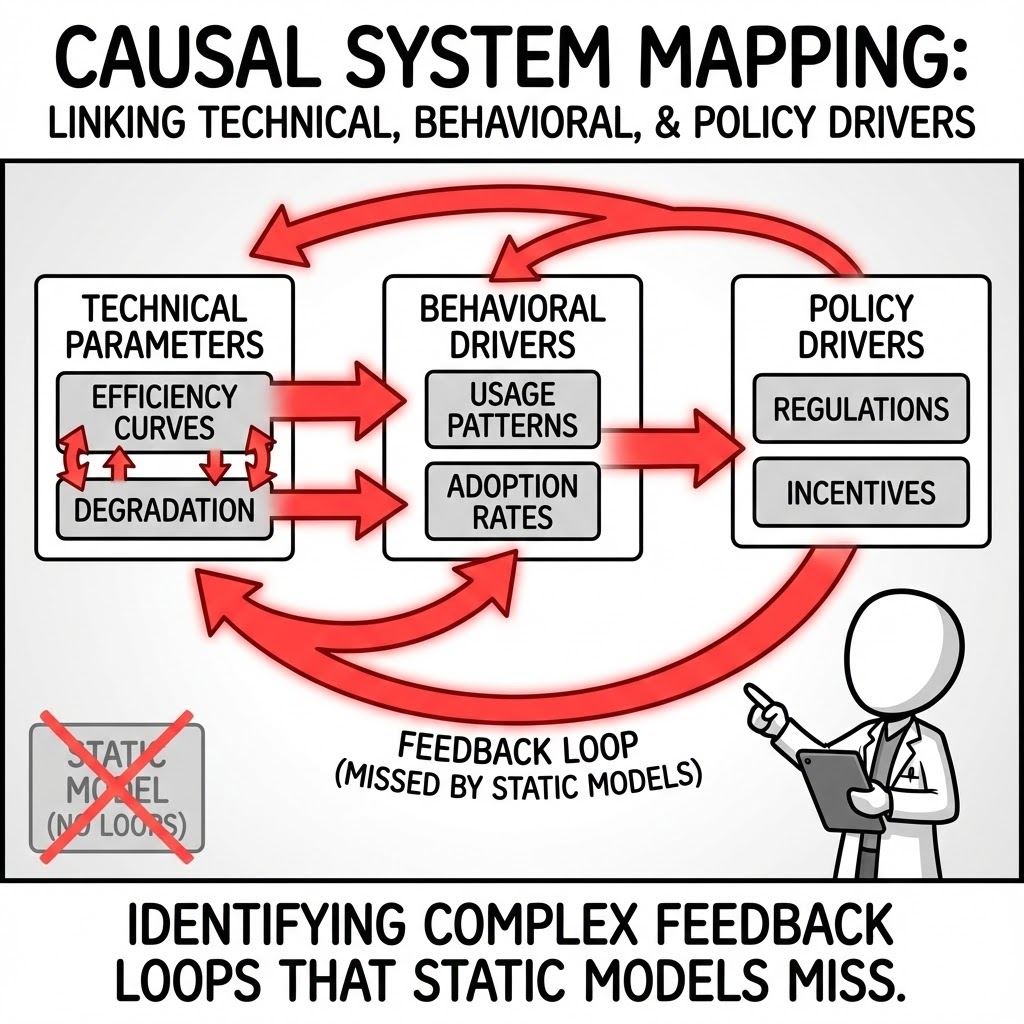
Causal System Mapping. We link technical parameters (e.g., efficiency curves, degradation) with behavioral and policy drivers, identifying feedback loops that static models miss.
The Strategic Imperative: Industrial assets are complex systems, not isolated spreadsheets. Physics and economics interact. For example, pushing a plant to maximum output (Economics) increases temperature and accelerates degradation (Physics), which eventually lowers efficiency (Economics). We map these causal loops to prevent "paper profits" that are physically unsustainable.
The Failure Mode: "Siloed Linearity." The engineering team assumes a fixed efficiency rate; the commercial team assumes a fixed price. Neither accounts for the feedback loop where high prices tempt operators to override safety limits, triggering a shutdown. These hidden correlations are where value leaks.
Practical Example: A green hydrogen project assumed constant electrolyzer efficiency. Our system map linked efficiency to "starts-and-stops" caused by intermittent wind power. The analysis revealed that the wear-and-tear from intermittency would double the stack replacement cost, turning the NPV negative.
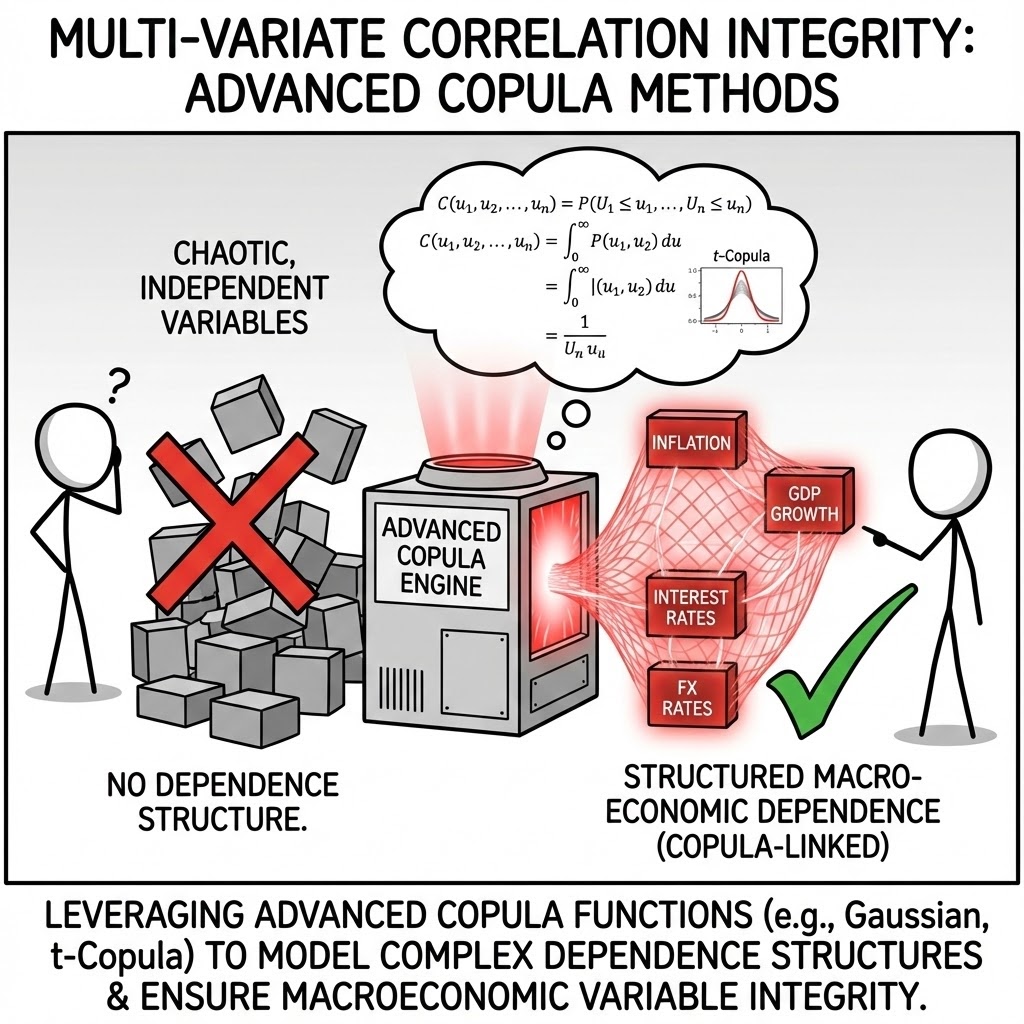
Multi-Variate Correlation Integrity. We ensure that input variables move in concert. We use advanced copula methods to maintain the structural integrity of the macro-economic environment during simulation.
The Strategic Imperative: Risks rarely arrive alone. High inflation usually correlates with high interest rates and often triggers currency devaluation. A robust model must preserve this "Joint Probability." We use statistical Copulas to ensure that when the model simulates a disaster in Variable A, it correctly simulates the associated stress in Variable B.
The Failure Mode: "Independent Randomness." If you simulate oil prices and airline stocks as independent variables, you might generate a scenario where oil is expensive and airline margins are high. This is economically incoherent. It leads to a false sense of diversification benefit that evaporates in a real crash.
Practical Example: A multi-asset mining company claimed their portfolio was diversified because they held Copper and Gold. Our correlation analysis showed that during liquidity crises, the correlation between these assets spikes to nearly 1.0. We forced a redesign of their hedging strategy to account for this "correlation breakdown."

High-Dimensional Compute. Our capability allows us to run tens of thousands of iterations, exploring the full state-space of the project rather than just a few "sensitivity scenarios."
The Strategic Imperative: You cannot find the edge of the cliff by looking at the average path. You find it by exploring the boundaries. We use brute-force computational power to simulate 10,000+ lifetimes of the project. This allows us to discover the "Perfect Storm" scenarios—rare combinations of events that destroy the project—which human intuition would never construct.
The Failure Mode: "The Lucky Three." Most investment committees see only three cases: Base, High, and Low. This is statistically meaningless. Real failure usually happens in the "grey zones"—for example, a moderate delay combined with a specific supply chain spike, which a High/Low analysis completely misses.
Practical Example: A large refinery expansion had a solid "Base Case." Our 50,000-iteration simulation found a specific cluster of scenarios (involving a specific currency pair movement and a labor strike) that had only a 2% probability but resulted in a 100% loss of equity. The client bought insurance specifically for that cluster.
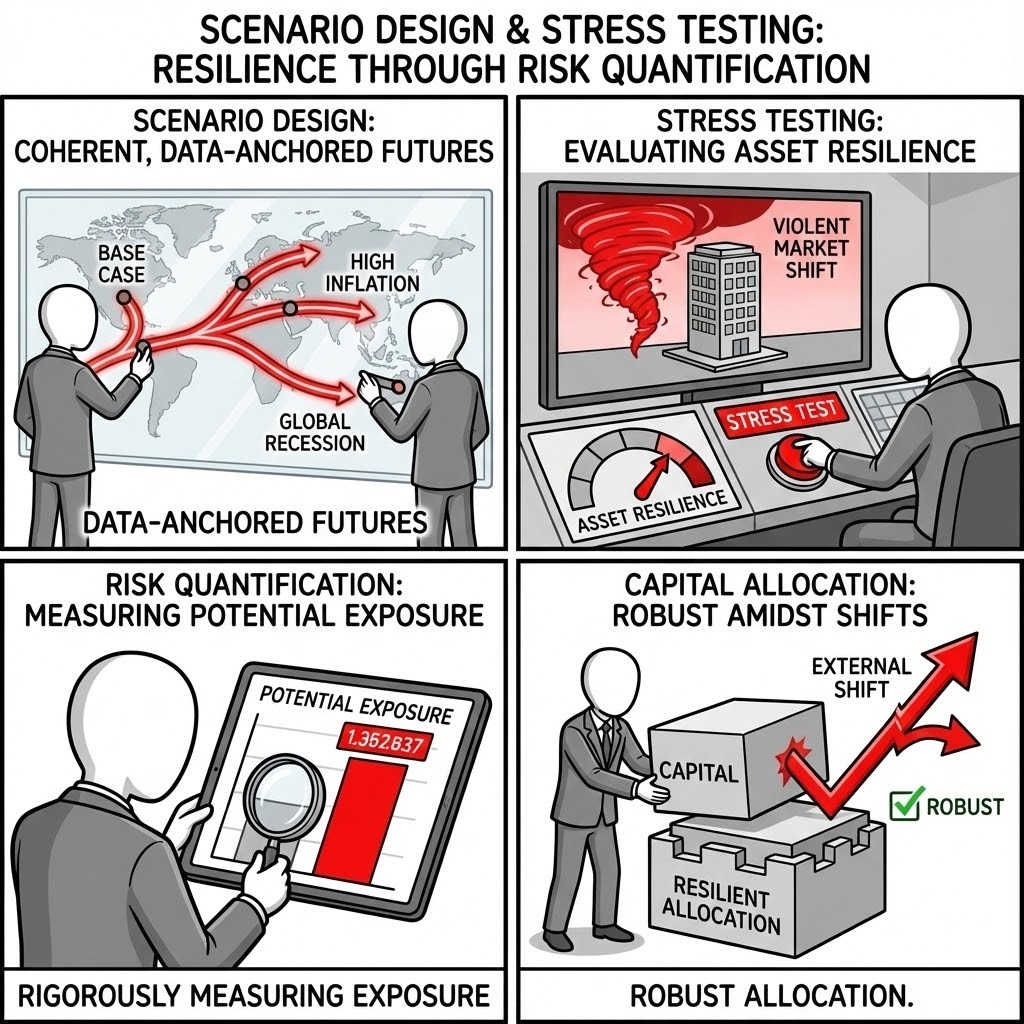
We utilize Scenario Design and Stress Testing to evaluate the resilience of assets across coherent, data-anchored futures. Our approach focuses on Risk Quantification, rigorously measuring potential exposure to ensure that capital allocation remains robust even when external environments shift violently.
A "Base Case" is a statistical improbability. We construct coherent future states that respect economic and physical laws. Our stress-testing does not just ask "what if?"—it quantifies "how much?" and "how likely?", providing the fiduciary evidence required for investment committee approval.
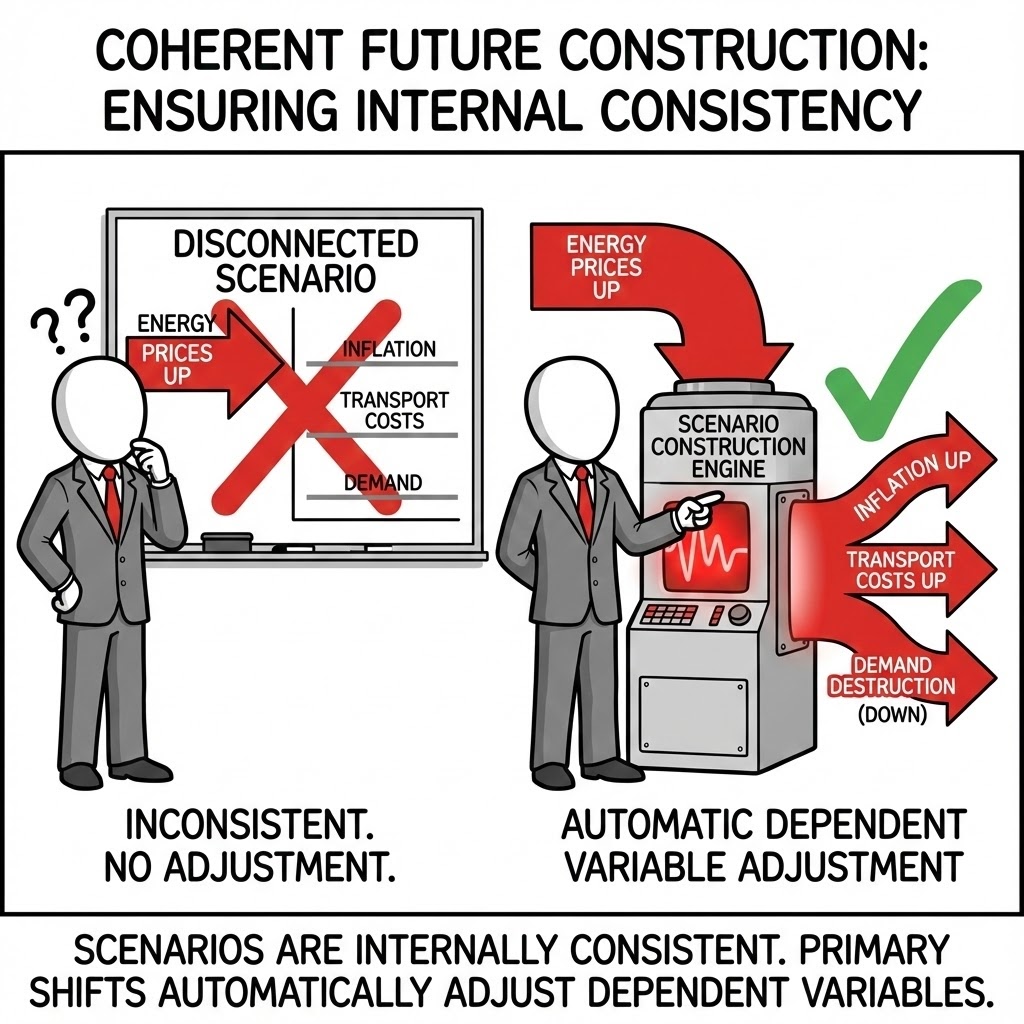
Coherent Future Construction. We ensure scenarios are internally consistent. If energy prices spike, our models automatically adjust dependent variables like inflation, transport costs, and demand destruction.
The Strategic Imperative: A scenario is not a wish list. It is a coherent economic state. You cannot model a world with "High GDP Growth" and "Record Low Energy Prices" simultaneously without a very specific technological explanation. We enforce "Macro-Consistency"—ensuring that if the model simulates a commodity boom, it also simulates the resulting cost inflation for your CAPEX.
The Failure Mode: "The Frankenstein Scenario." Deal teams often cherry-pick the best assumptions from different bank forecasts—Low Inflation (from Bank A) and High Revenue (from Bank B)—stitching them together into a "Base Case" that is economically impossible. This guarantees the investment case is overstated.
Practical Example: A logistics firm projected record profits based on cheap diesel and high consumer demand. Our coherent modeling showed that cheap diesel only occurs during recessions (when demand crashes). Correcting this correlation reduced their projected free cash flow by 40%.
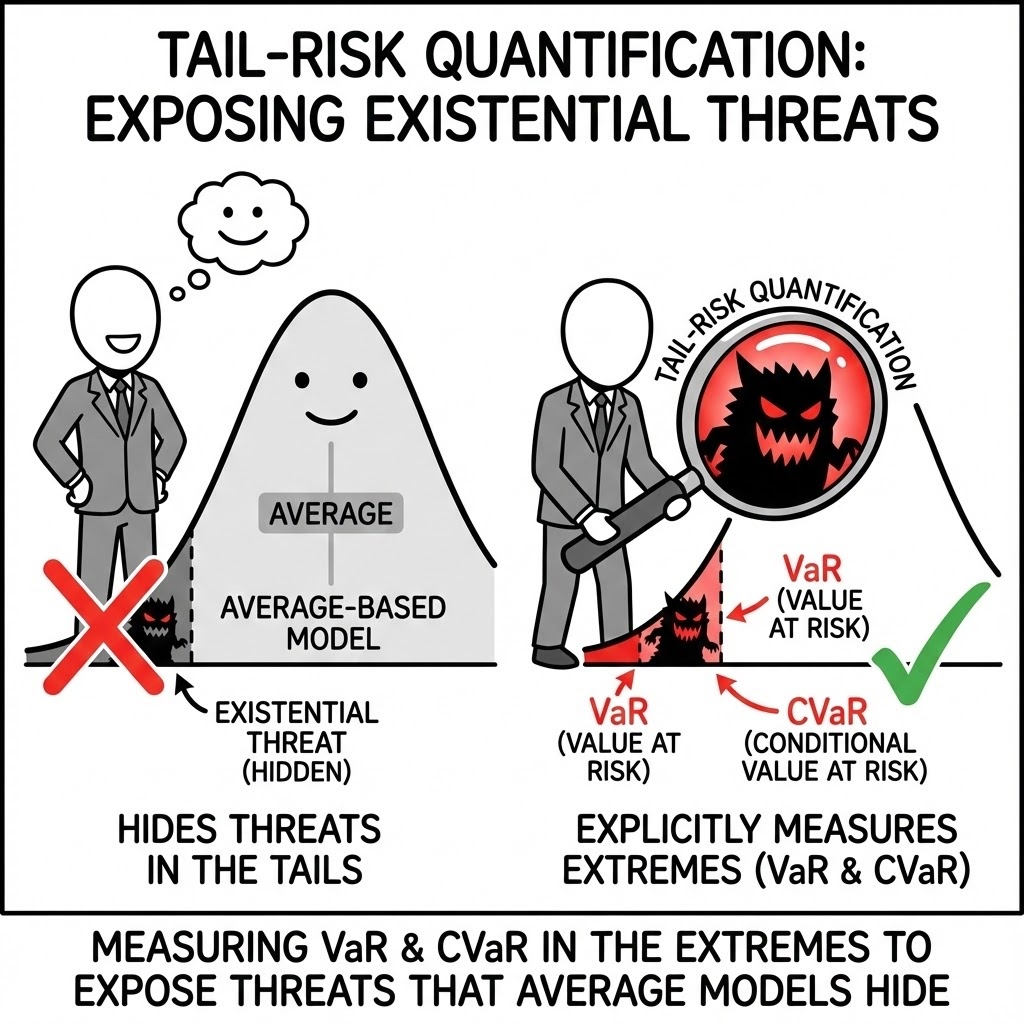
Tail-Risk Quantification. We explicitly measure "Value at Risk" (VaR) and "Conditional Value at Risk" (CVaR) in the extremes of the distribution, exposing existential threats that average-based models hide.
The Strategic Imperative: In capital-intensive industries, you don't die from the average day; you die from the "Bad Day." Traditional NPV looks at the weighted average, which masks the potential for ruin. We explicitly calculate the "CVaR 95"—the average loss on the worst 5% of days—to ensure you have the balance sheet to survive the storm.
The Failure Mode: "The River Crossing." A standard model tells you the river is, on average, 3 feet deep. It fails to mention the one spot that is 20 feet deep. Managers relying on averages often leverage up, only to be wiped out by a single quarter of extreme volatility.
Practical Example: A sovereign wealth fund was reviewing a port expansion. The average yield was 12%. Our Tail-Risk analysis revealed a 15% probability of a "negative equity" event if interest rates rose rapidly during construction. The fund required the developer to buy interest rate caps before signing.
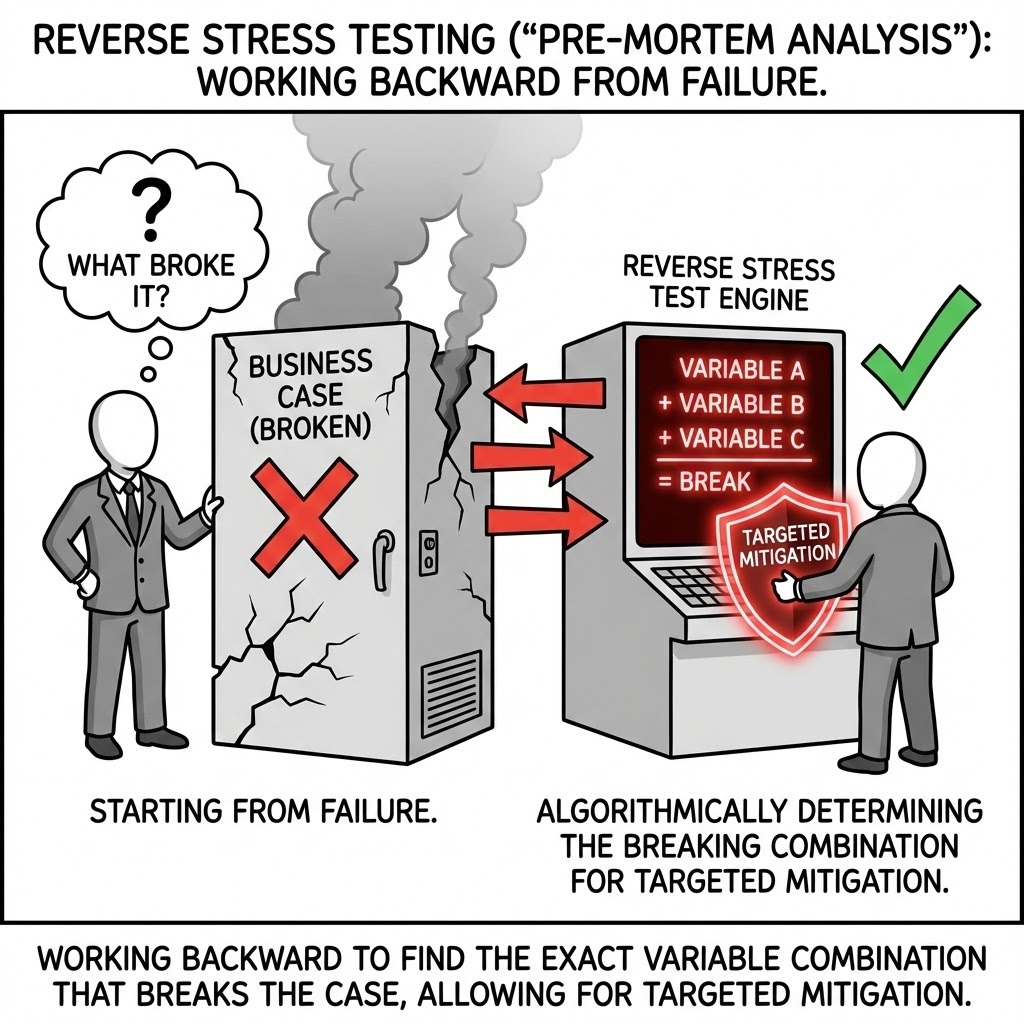
Reverse Stress Testing ("Pre-Mortem Analysis"). We work backward from failure. We algorithmically determine exactly which combination of variables breaks the business case, allowing for targeted mitigation.
The Strategic Imperative: Instead of asking "What is the probability of failure?", we ask "What exactly causes failure?" We invert the model to find the "Kill Chain"—the precise combination of a 3-month delay, a 5% cost overrun, and a 2% interest rate hike that triggers a default. Once identified, these specific risks can be contractually mitigated.
The Failure Mode: "Blind Sensitivity." Running a standard +/- 10% sensitivity on all variables creates a tornado chart that looks impressive but tells you nothing about interaction effects. It fails to identify the specific "poison pill" combination that is most likely to occur.
Practical Example: We analyzed a Bio-Ethanol plant that seemed robust. Reverse stress testing found a specific "Death Zone": if corn prices rose by 15% *while* gas prices stayed flat, the margin collapsed. The client used this insight to structure a specific "Crack Spread" hedge that cost far less than general insurance.
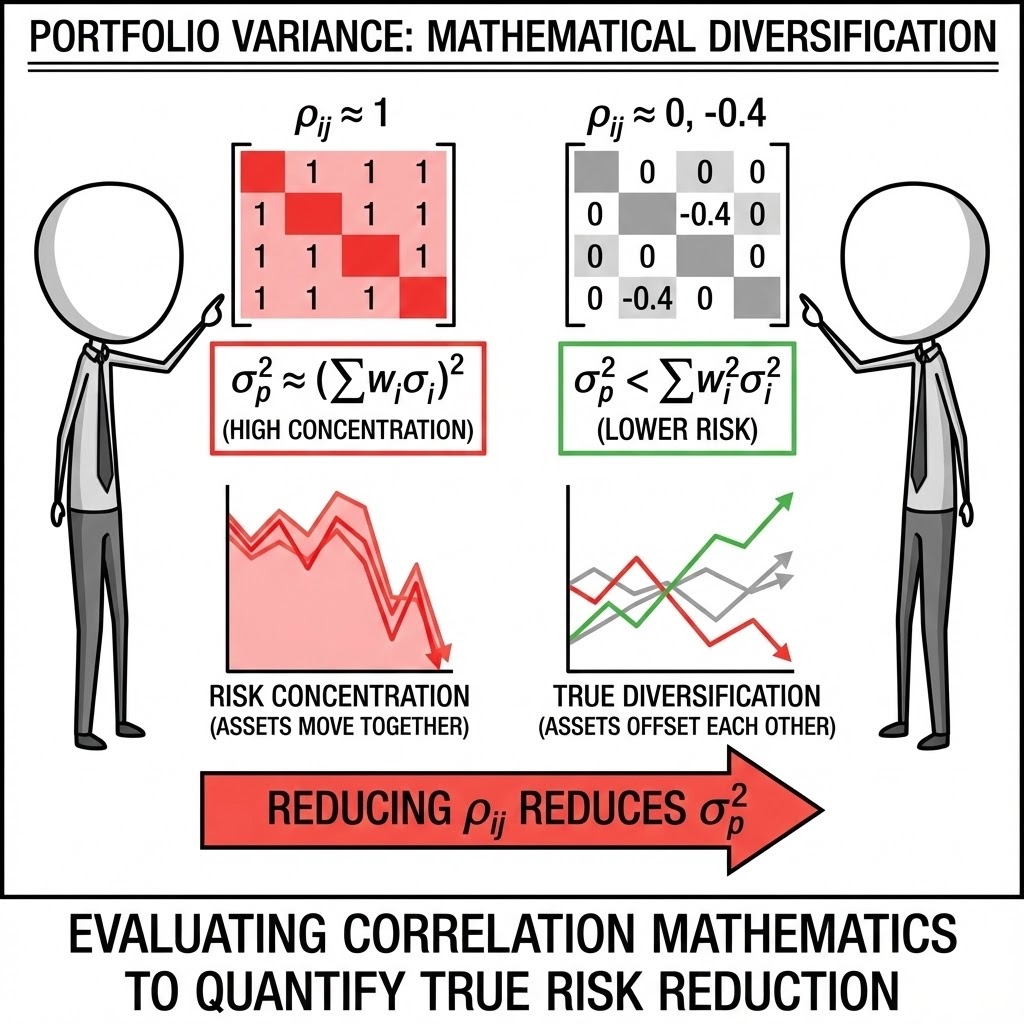
Portfolio Correlation Analysis. We evaluate how a new asset interacts with existing holdings, identifying whether a project provides true diversification or concentrates risk during market downturns.
The Strategic Imperative: True diversification is hard to find. In a crisis, correlations tend to converge to 1.0 (everything falls together). We mathematically test whether adding a new project actually lowers the risk of your total portfolio, or if it just adds more of the same exposure you already have (e.g., hidden energy price sensitivity).
The Failure Mode: "Illusory Diversification." A holding company might buy a copper mine to diversify away from its oil assets. However, since both are driven by global Chinese demand and the US Dollar index, they crash simultaneously. The diversification benefit was a mirage.
Practical Example: A family office wanted to invest in a "Green Tech" fund to balance their "Old Economy" manufacturing portfolio. Our correlation analysis showed that both portfolios were highly sensitive to interest rate hikes. We advised them to buy into a catastrophic reinsurance fund instead, which had zero correlation to rates.
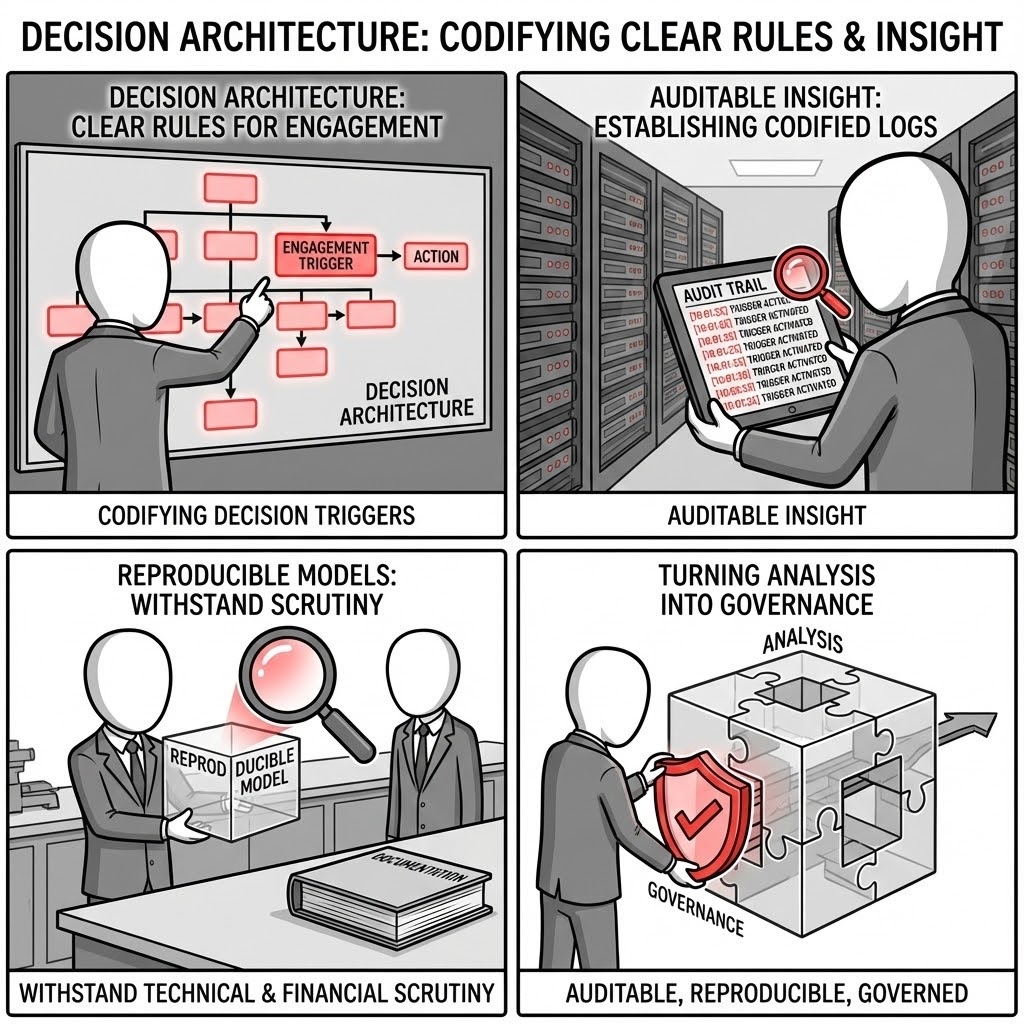
We implement a Decision Architecture that defines clear rules for engagement—codifying Decision Triggers and establishing Auditable Insight. We deliver reproducible models and clear documentation that withstand technical and financial scrutiny, turning analysis into a governance tool.
Complexity requires clarity. We bridge the gap between quantitative rigor and executive governance by translating sophisticated mathematics into binary decision rules. Our work is built on the principles of functional correctness and reproducibility, ensuring that the logic holding the investment thesis together is transparent and immutable.
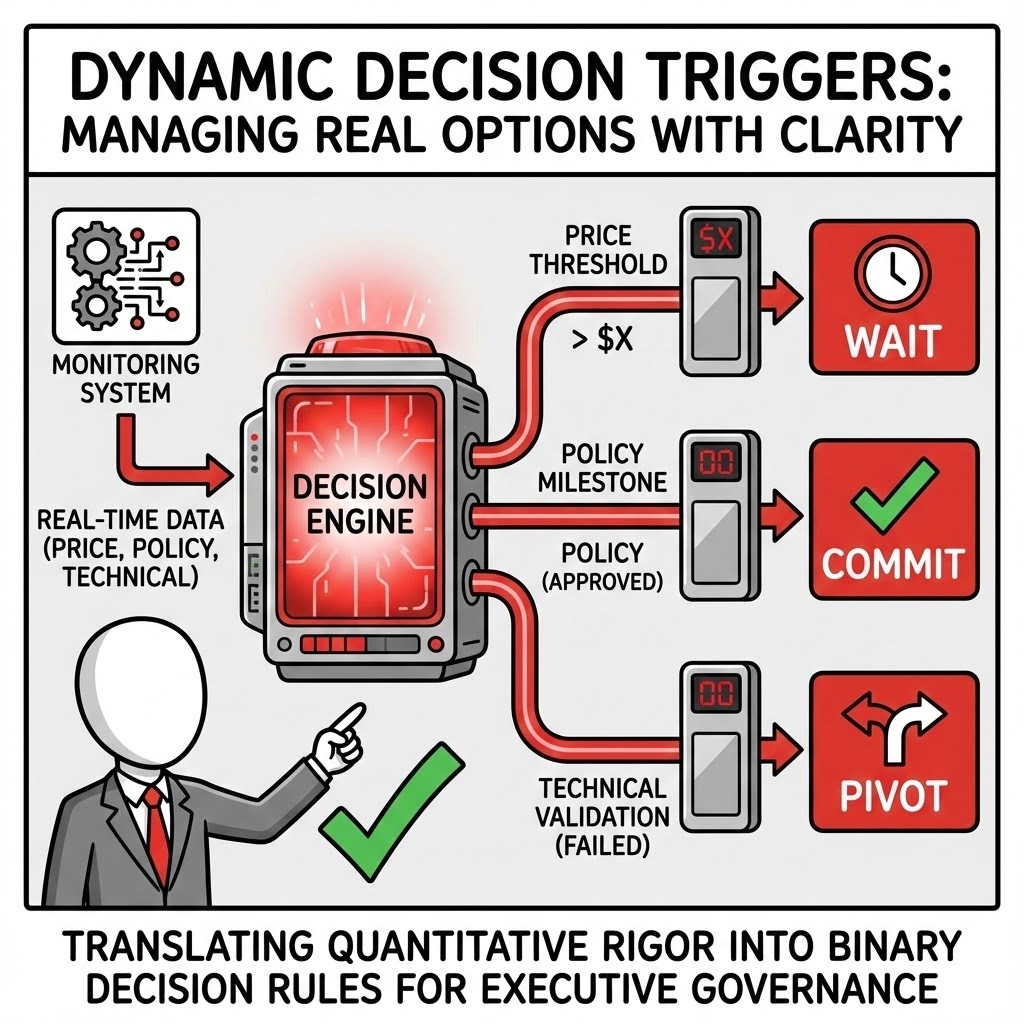
Dynamic Decision Triggers. We define the exact thresholds—be it price, policy milestone, or technical validation—that should trigger a "Wait," "Pivot," or "Commit" decision, effectively managing the project's Real Options.
The Strategic Imperative: In the heat of a deal, emotion overrides logic. "Goalposts" are moved to justify sinking more capital into a struggling project. We pre-negotiate the "Kill Switches" and "Go-Signals" while heads are cool. This converts strategy from a debate into a disciplined execution protocol: "If X happens, we strictly do Y."
The Failure Mode: "Escalation of Commitment." Managers often throw good money after bad because they lack a pre-defined exit criterion. Without a hard trigger, the project drifts into a "Zombie State"—consuming management bandwidth without ever delivering a return.
Practical Example: A mineral exploration firm agreed to a "Drill-or-Drop" trigger we designed. When the first three cores showed grade quality below 0.8% (the trigger), the project was automatically halted. This saved $12M in further drilling costs that management admitted they otherwise would have spent "just to be sure."
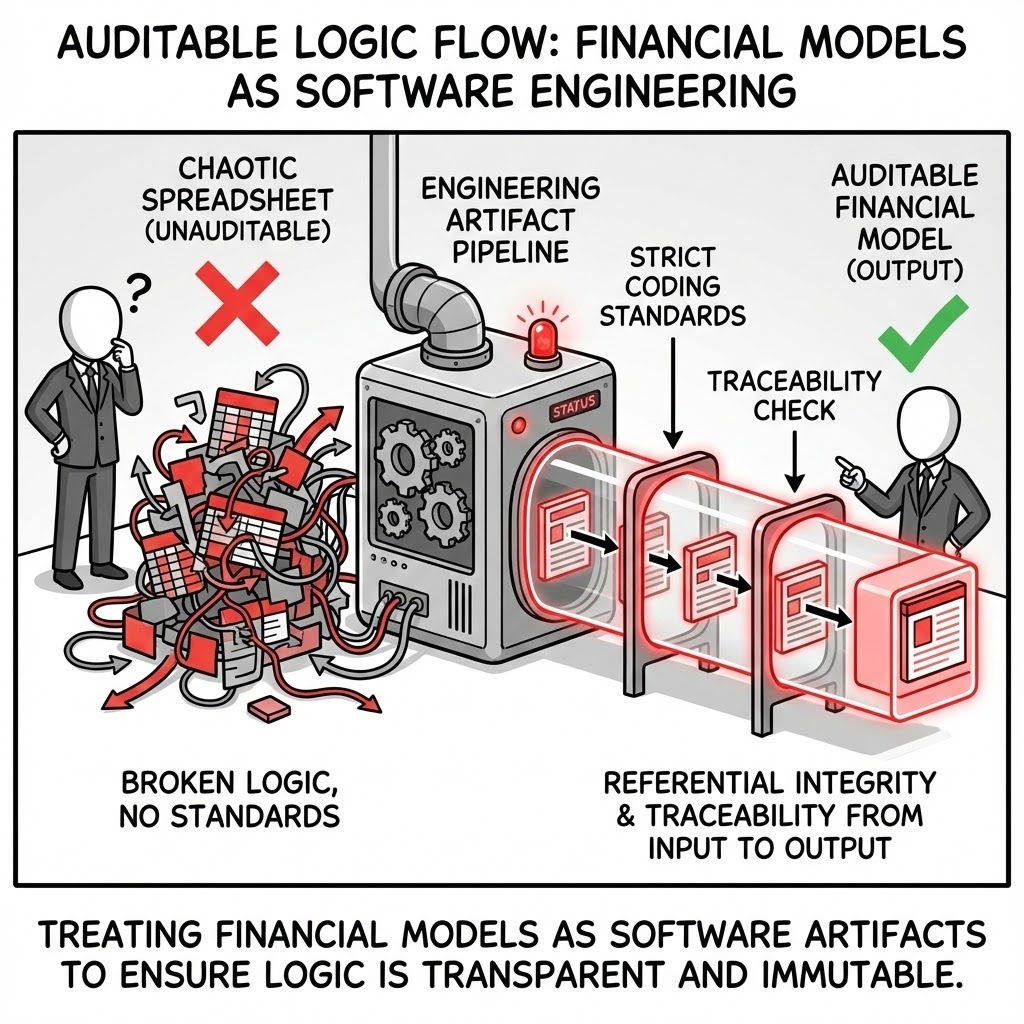
Auditable Logic Flow. We adhere to strict coding and modeling standards, treating financial models as software engineering artifacts to ensure referential integrity and traceability from input to output.
The Strategic Imperative: A model is not a spreadsheet; it is an application that manages millions in capital. We apply software engineering discipline—modular architecture, version control, and strict variable naming. This ensures that a third-party auditor can validate the entire calculation chain in hours, not weeks, removing a major bottleneck to Financial Close.
The Failure Mode: "Spaghetti Logic." When formulas reference random cells across multiple tabs without structure, the model becomes fragile. A simple update (like adding a new debt tranche) breaks unrelated calculations (like tax carry-forwards), creating errors that are nearly impossible to detect until cash runs out.
Practical Example: During the sale of a pipeline asset, the buyer’s due diligence team found a circular reference in the seller’s model that artificially inflated the IRR. The deal stalled for three weeks while the model was rebuilt, ultimately resulting in a $20M price reduction due to "loss of confidence."
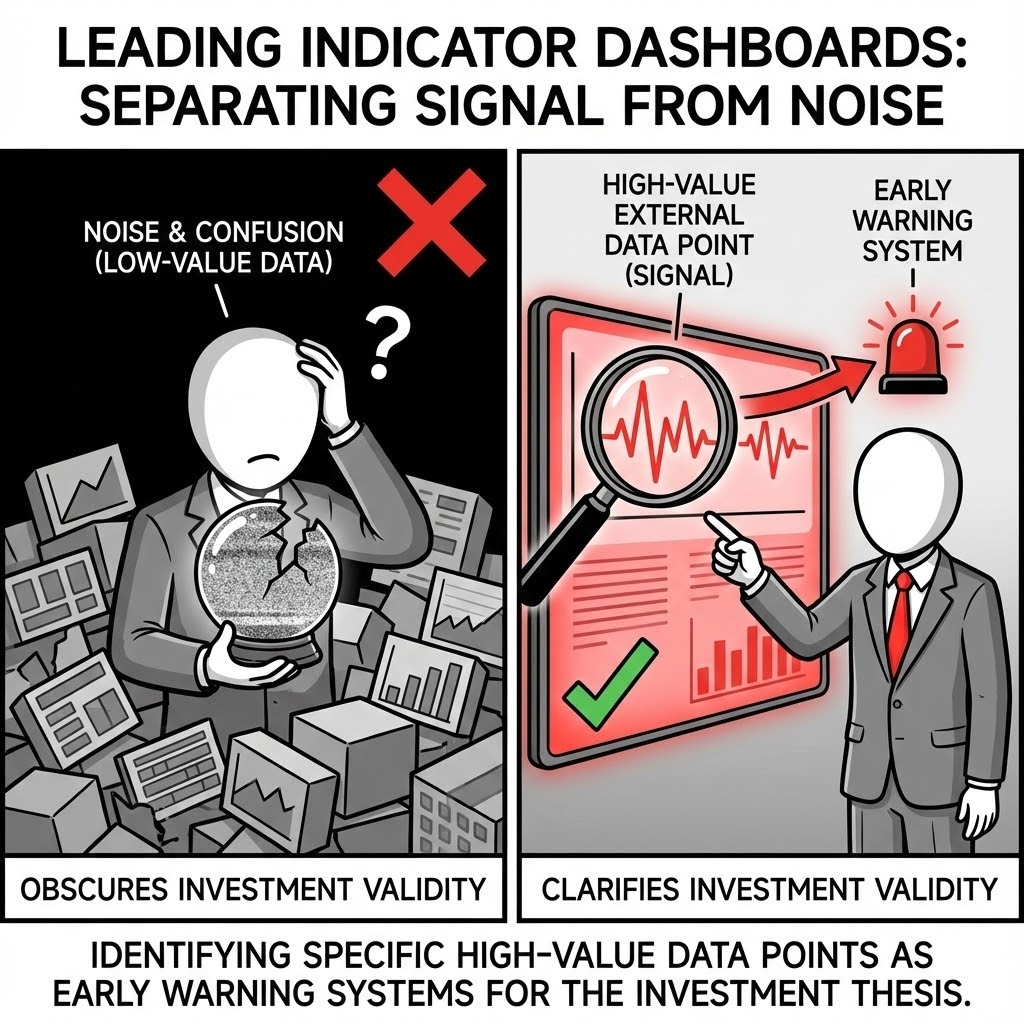
Leading Indicator Dashboards. We separate signal from noise, identifying the specific high-value external data points that serve as early warning systems for the validity of the investment thesis.
The Strategic Imperative: Most reporting is an autopsy—it tells you what happened last month. Effective governance requires "Radar"—seeing what is coming. We identify the 3-5 external variables (e.g., steel futures, regulatory filing counts, competitor permit applications) that statistically predict your project's future performance, allowing for proactive course correction.
The Failure Mode: "Rearview Management." Boards often obsess over variance analysis of past budgets while missing the macro-shift that is about to wipe out the business case. By the time the "Actuals" show the problem, it is too late to hedge.
Practical Example: For a construction conglomerate, we built a dashboard tracking "Rig Count" and "Cement Futures" rather than current invoice prices. This leading indicator flagged a coming inflationary spike 4 months early, allowing the procurement team to lock in fixed-price contracts before the market moved.
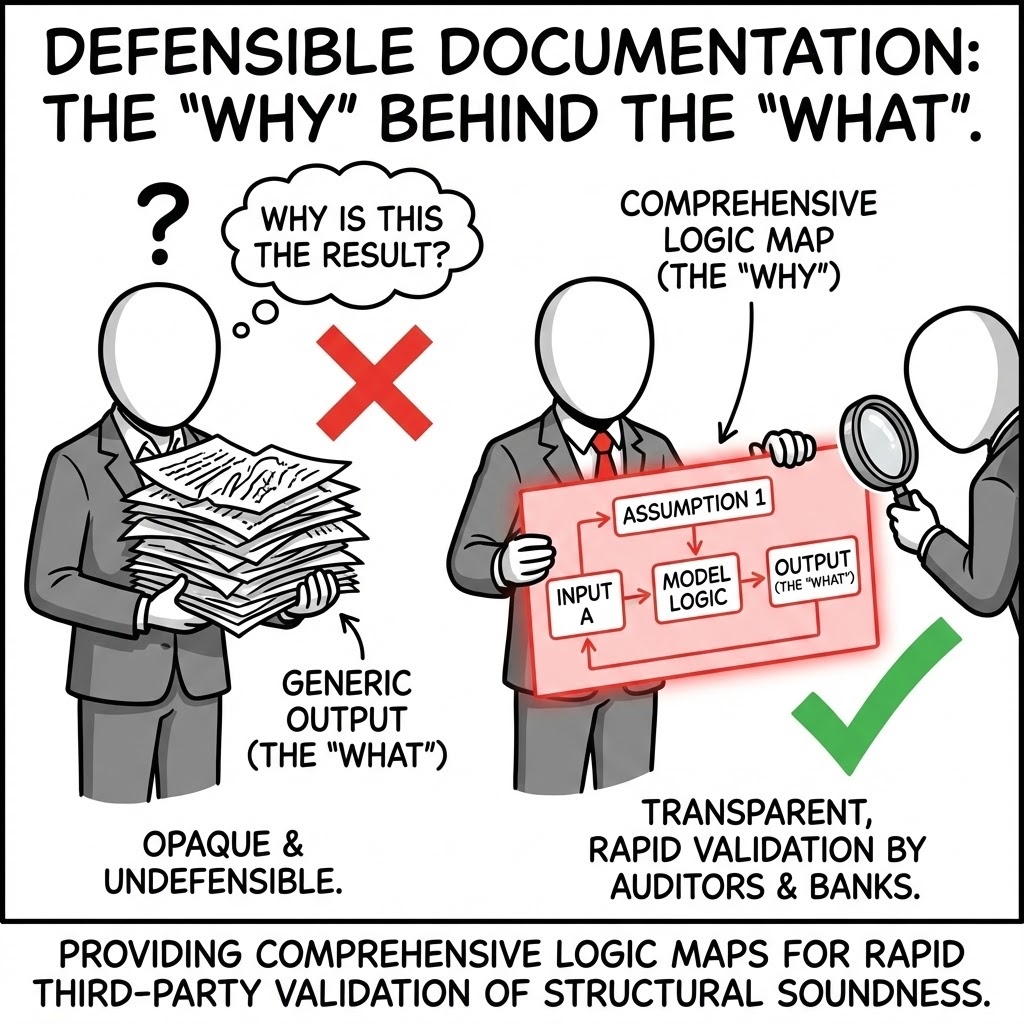
Defensible Documentation. We provide the "Why" behind the "What." We deliver comprehensive logic maps that allow third-party auditors and banks to validate the structural soundness of the model rapidly.
The Strategic Imperative: Institutional memory is fleeting. Three years from now, no one will remember why the "Availability Factor" was set to 92.4%. We deliver "Data Books" and "Logic Maps" that cite the specific engineering report, contract clause, or market study behind every single input. This makes the model defensible in court, in tax audits, and in credit committees.
The Failure Mode: "Tribal Knowledge." When the primary modeler leaves the firm, the rationale leaves with them. The remaining team is terrified to change any assumption because they don't understand the original justification, freezing the strategy in the past.
Practical Example: A utility faced a regulatory challenge on their rate-base calculation. Because our model had a "Source Map" linking every cost assumption to a specific regulatory filing, the legal team was able to defend the numbers immediately, preventing a potential rate freeze.
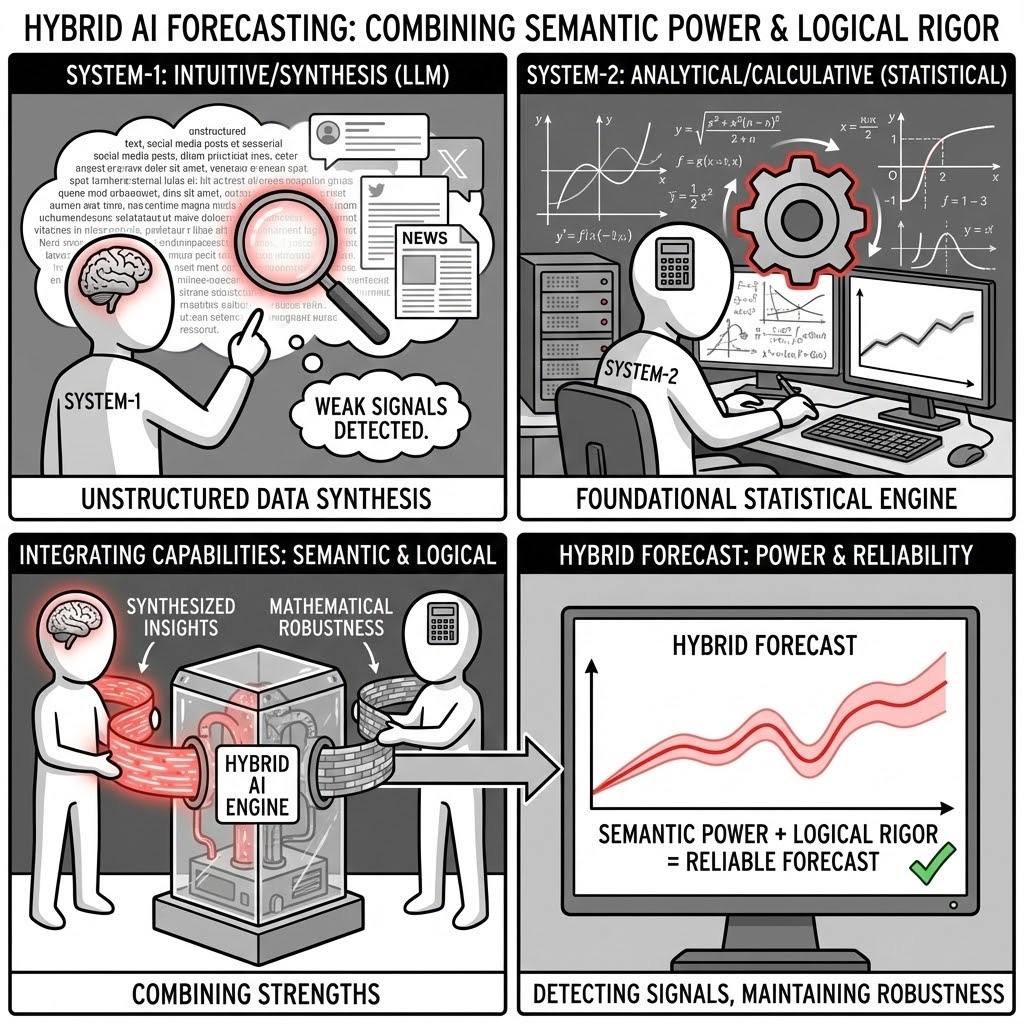
We employ Hybrid AI Forecasting methods that combine the semantic power of Large Language Models (LLMs) with the rigorous logic of foundational statistical engines. By integrating System-1 (Intuitive/Synthesis) capabilities with System-2 (Analytical/Calculative) reliability, we detect weak signals in unstructured data while maintaining mathematical robustness.
In an era of noise, the advantage lies in synthesis. We reject the "black box" approach to AI. Instead, we use a hybrid architecture where AI agents are used to parse vast unstructured datasets (policy documents, news flow, sentiment), which then feed into deterministic, verifiable mathematical cores. This ensures innovation without hallucination.
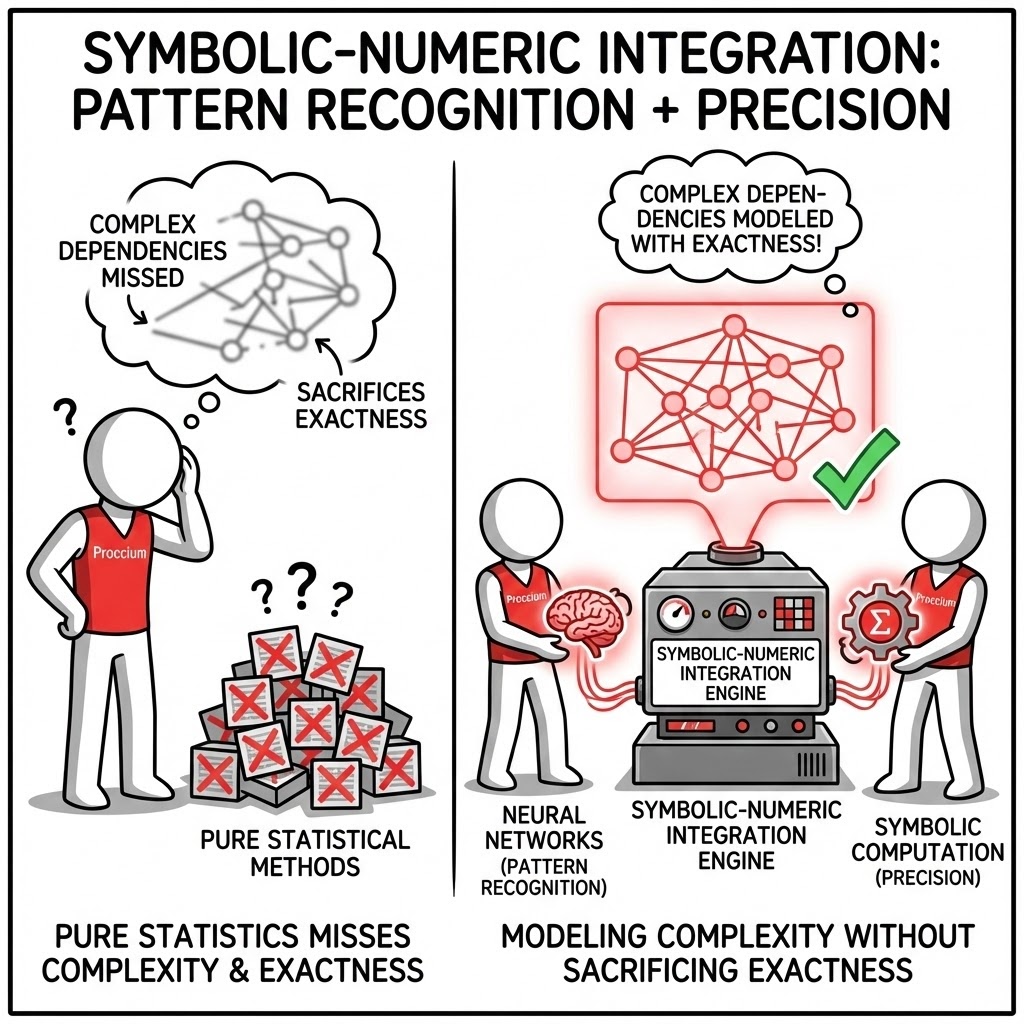
Symbolic-Numeric Integration. We pair the pattern-recognition strengths of neural networks with the precision of symbolic computation. This allows us to model complex dependencies that purely statistical methods miss, without sacrificing exactness.
The Strategic Imperative: Pure Neural Networks are powerful but "physically illiterate"—they can predict negative mass or energy efficiency above 100%. We enforce "Physics-Informed AI." We use neural nets to find complex market patterns, but we constrain them with symbolic equations (Conservation of Energy, Mass Balance, Accounting Identity). This ensures the output is not just plausible, but physically and financially valid.
The Failure Mode: "Black Box Hallucination." A pure AI model might predict a massive drop in production costs based on a historical pattern, ignoring that the laws of thermodynamics make that cost reduction physically impossible. Investing based on such "miracle" predictions leads to capital destruction.
Practical Example: A battery storage operator used a pure AI model to optimize charging cycles. The model started recommending physically dangerous discharge rates to maximize revenue. Our hybrid model imposed a hard symbolic constraint (thermal limits), sacrificing 2% theoretical revenue to ensure the facility didn't catch fire.
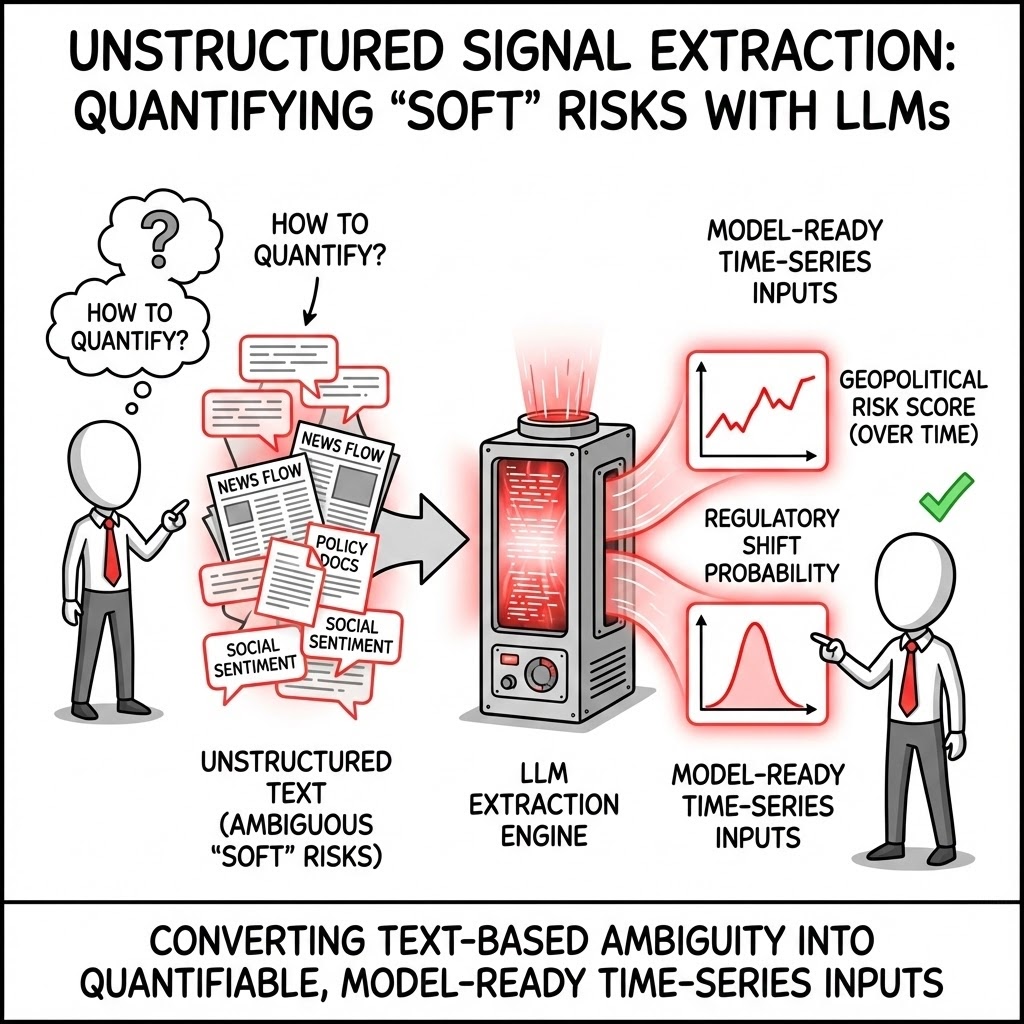
Unstructured Signal Extraction. We utilize LLMs to quantify "soft" risks—such as geopolitical sentiment or regulatory shift probability—converting text-based ambiguity into model-ready time-series inputs.
The Strategic Imperative: The biggest risks to your project are rarely in the spreadsheet; they are in the news cycle and legislative dockets. We quantify the qualitative. By scraping thousands of local news articles and policy drafts, we build "Sentiment Indices" that act as leading indicators for tax hikes, strikes, or permit delays, feeding these directly into the risk model.
The Failure Mode: "The Ostrich Effect." Executives often ignore political risk because "it can't be modeled." This leaves the project exposed to binary shocks. When a new mining royalty law is suddenly passed, the "optimized" financial model becomes instantly obsolete.
Practical Example: For a copper mine in South America, we built a "Social License Index" based on local radio transcripts and social media. The index spiked two weeks before physical protests blocked the access road, allowing the client to reroute supply trucks and avoid a costly shutdown.
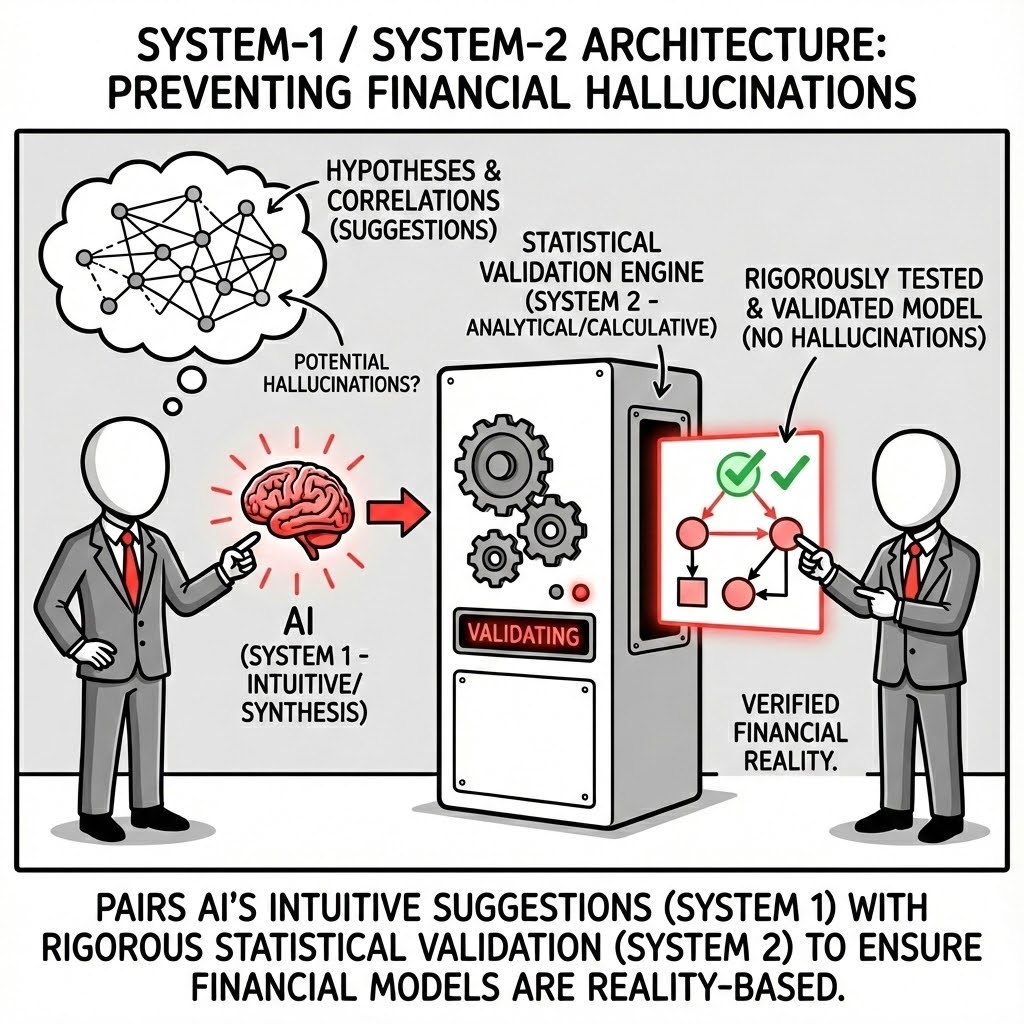
System-1 / System-2 Architecture. This is designed to prevent "hallucinations" in financial contexts. The AI suggests correlations and hypotheses (System 1), which are then rigorously tested and validated by foundational statistical models (System 2).
The Strategic Imperative: Generative AI is creative; Finance requires accuracy. We separate the roles. The AI acts as the "Analyst" (System 1), scanning vast datasets to propose novel correlations (e.g., "Rainfall in Chile affects Copper Price"). The Statistical Engine acts as the "Auditor" (System 2), mathematically testing that hypothesis for causality and significance before allowing it into the model.
The Failure Mode: "Spurious Correlation." An AI might notice that "Stock Market returns correlate with Sunspot activity" (a known statistical coincidence). Without a System-2 filter, an automated trading strategy would bet real capital on this nonsense, leading to inevitable losses when the coincidence breaks.
Practical Example: Our AI suggested a correlation between "Global Container Indices" and "Regional Power Prices." The System-2 engine validated this as a causal link (coal import costs), allowing us to incorporate shipping rates as a valid leading indicator for the client's energy cost hedging.
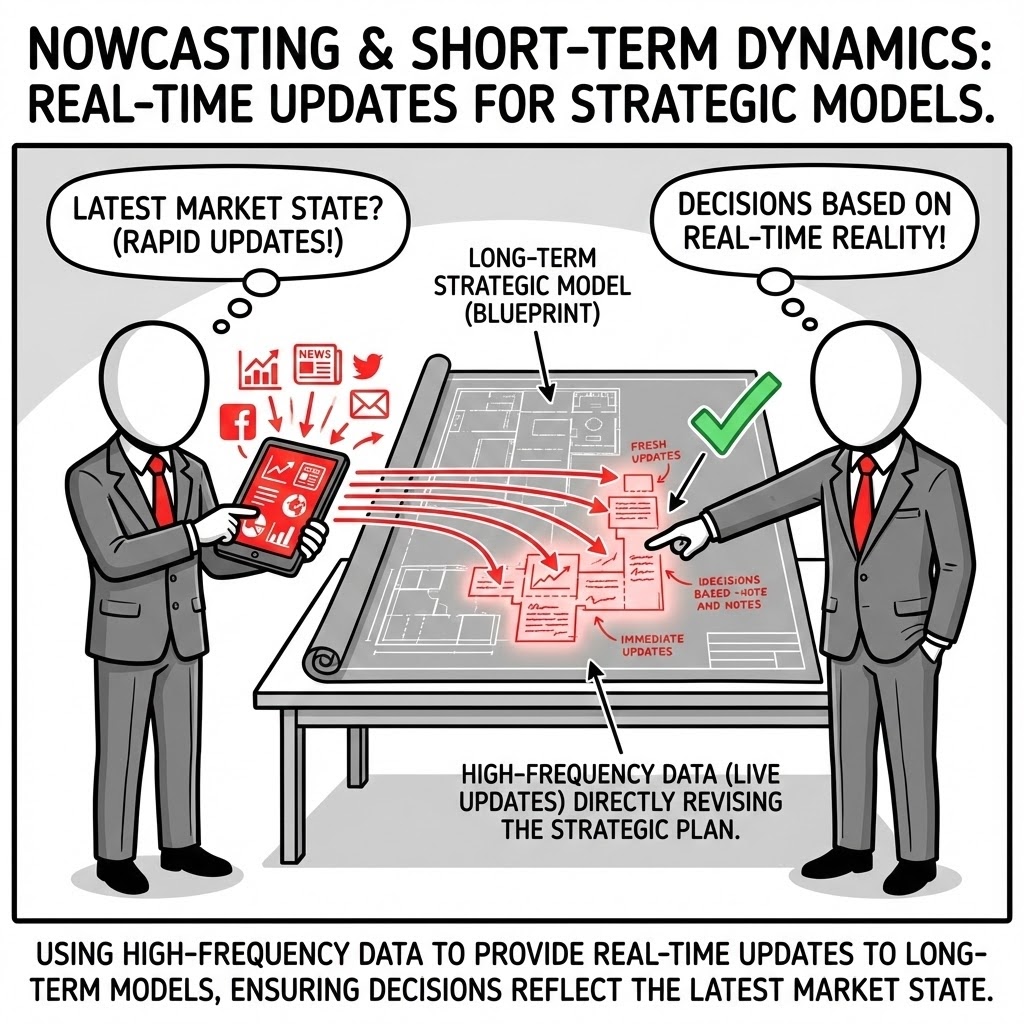
Nowcasting & Short-Term Dynamics. We use high-frequency data ingestion to provide real-time updates to long-term strategic models, ensuring that decisions are based on the very latest market state.
The Strategic Imperative: Strategic plans often rot on the shelf. A 5-year plan based on Q1 data is dangerous by Q3. We pipe live data (satellite imagery, port traffic, spot prices) into the long-term valuation model. This creates a "Living Strategy" that automatically re-calculates the probability of success every morning based on yesterday's reality.
The Failure Mode: "Static Plan Paralysis." Management teams often stick to the annual budget even when the assumptions are dead. They continue spending on a project that has already crossed the "Kill Threshold" because the formal review isn't due for another three months.
Practical Example: A logistics client used monthly inflation data to set pricing. We switched them to a "Nowcast" using daily fuel and labor indices. When a sudden inflationary spike hit, they adjusted surcharges 6 weeks before their competitors, preserving $4M in margin that others lost to lag.
Perspective
Prediction creates the illusion of control; understanding establishes control through discipline. Engineered Foresight replaces optimism with structure—quantifying what can be known, clarifying what cannot, and designing decisions that remain valid when circumstances shift.
In essence, it is the mathematics of realism: an approach that brings rigour, transparency, and accountability to how organisations prepare for uncertainty.
The conversation begins here. office@proccium-com · +43 664 454 21 20