Strategic Project Development :: The Antidote to Megaproject Underperformance
Large industrial investments are high-stakes, infrequent events often characterized by optimism bias, escalating complexity, and institutional misalignment. Proccium operates continuously in this domain, providing the analytical certainty required when capital commitments are irreversible.
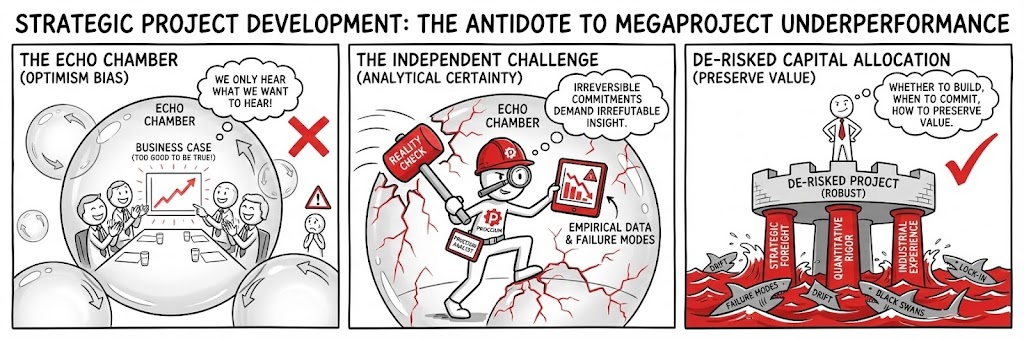
We are not advisors on how to build, but on whether to build, when to commit, and how to preserve value when circumstances shift. We apply a disciplined methodology that integrates strategic foresight, quantitative rigor, and deep industrial experience to confront the failure modes well-documented in megaproject literature.
Why do the vast majority of large-scale industrial ventures fail to deliver on their original promise? The answer is rarely a lack of engineering talent. Failure is almost always structural, cognitive, and organizational—a result of decision-making pathologies that are baked into the standard capital approval process.
We exist to intervene before these distinct failure modes destroy shareholder value:

The "Survival of the Unfittest." Projects are rarely approved based on realistic numbers; they are funded based on the most attractive numbers. This creates a perverse incentive structure where the most optimistic—and least realistic—business cases win capital.
The Strategic Imperative: Corporate capital allocation is often a "Reverse Darwinism." The prudent manager who includes adequate contingency is rejected for being "too expensive," while the reckless manager who ignores risk gets funded. We act as the fiduciary circuit-breaker. We replace "success-oriented" planning with Reference Class Forecasting—forcing the project to confront the empirical reality of similar past endeavors, regardless of how uncomfortable that makes the deal team.
The Failure Mode: "The Winner's Curse." To win the internal competition for funds, the project team strips away all safety margins. The project is approved on a razor-thin budget that mathematically guarantees an overrun before the first shovel hits the ground.
Practical Example: A hydrogen consortium won a bid by assuming a 98% electrolyzer efficiency availability from Day 1. We demonstrated that no similar plant globally had exceeded 85% in its first year. The resulting revenue shortfall would have triggered a default in Month 6. The bid was painful to retract, but saved the sponsors $200M.

The Normalization of Deviance. Catastrophes are rarely sudden. Systems "drift" toward failure through incremental steps that look like success—cost-cutting, efficiency gains, and minor specification compromises—until a hidden safety boundary is crossed.
The Strategic Imperative: In the pursuit of "Lean," organizations often cut muscle thinking it is fat. A deviation that causes no immediate disaster (e.g., skipping a soil test, delaying a maintenance cycle) becomes the new standard. We map these invisible interdependencies to identify where the system has drifted into the "Danger Zone" without leadership realizing it.
The Failure Mode: "The Boiling Frog." Management applauds the cost savings from reducing "redundancy," not realizing they are actually removing the system's immune system. When a minor shock eventually hits, the stripped-down project collapses because it has zero shock-absorption left.
Practical Example: A refinery project steadily reduced its spare parts inventory to improve Working Capital metrics. It looked like 'efficiency' on the balance sheet until a critical compressor failed. With no spare on site due to the 'optimization,' the plant suffered a 6-week outage costing 50x the value of the saved inventory.

Asymmetric "Fat Tail" Exposure. Megaprojects are fragile to time. The longer the window of execution, the higher the probability of a nonlinear shock (policy reversal, macro-shift, supply chain fracture). We restructure projects to shorten time-horizons and modularize execution.
The Strategic Imperative: Time is not money; time is risk. In a 5-year project, you are betting that the geopolitical and regulatory world will remain stable for 1,800 days. This is a bad bet. We enforce "Temporal Parsimony"—breaking massive monoliths into modular, execution-ready phases. This reduces the "Surface Area of Risk" exposed to the chaos of the outside world.
The Failure Mode: "The Event Horizon." A project with a 7-year timeline is statistically likely to encounter at least one "1-in-10 year" crisis (pandemic, war, crash). If the project cannot survive that shock, it shouldn't be started. Standard planning ignores this probability entirely.
Practical Example: An offshore wind project had a rigid 4-year installation schedule. We forced a redesign into two 2-year phases. When a global steel shortage hit in Year 3, the client had already commissioned Phase 1 and was generating cash, whereas a rigid single-phase competitor went bankrupt holding an unfinished asset.

Premature Technical Lock-In. Most failures occur because management commits to a specific technical solution before fully understanding the commercial problem. We enforce "Real Options" thinking, maintaining design liquidity and delaying irreversible commitments.
The Strategic Imperative: Engineers love certainty; Strategists love optionality. Tension arises when teams order "Long Lead Items" (e.g., turbines) early to "secure the schedule," effectively freezing the strategy before the market is proven. We fight to maintain "Design Liquidity"—keeping the engineering fluid until the "Value of Information" justifies the lock-in.
The Failure Mode: "The Sunk Cost Prison." Once you pour concrete or sign a binding procurement contract, you are a prisoner of that design. If the market shifts (e.g., gas becomes cheaper than hydrogen), you cannot pivot without a massive write-down. Management then proceeds with a bad project simply to avoid admitting the mistake.
Practical Example: A biofuel client wanted to lock in a specific gasification technology immediately. We enforced a 6-month delay to run feedstock trials. The trials proved the tech couldn't handle the local biomass moisture content. The delay cost $500k; the premature lock-in would have cost $80M in useless equipment.
If your project feels like a train that cannot be stopped despite flashing warning signals, you are likely experiencing Commitment Escalation. Our role is to provide the objective, data-backed friction required to either correct the trajectory or safely halt the investment before value is permanently impaired.
The Proccium Lens: Confronting the Hidden Exposures
Most projects fail quietly—through a hundred unchallenged assumptions, not one dramatic mistake. Our work is dedicated to identifying and quantifying these hidden exposures early.
1. De-risking the Decision Boundary (The “Should We?”)
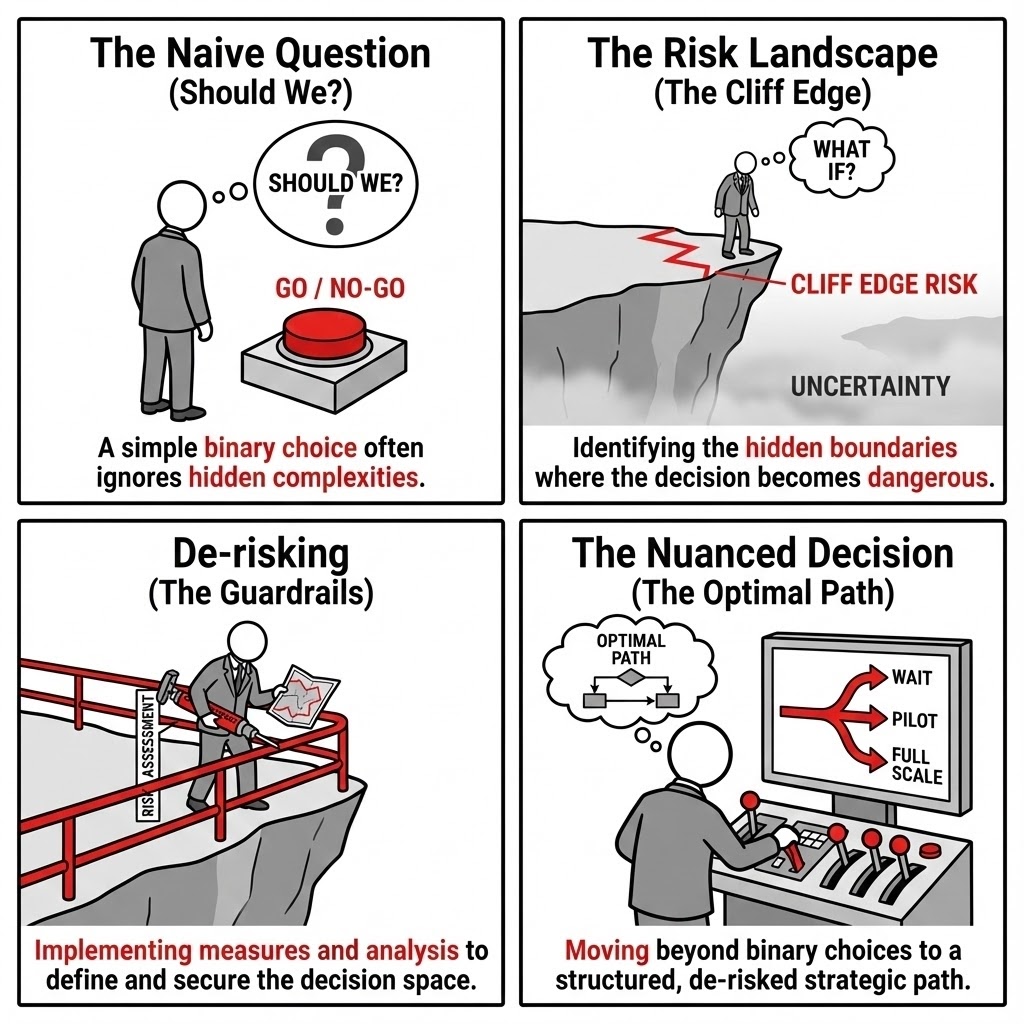
We execute a Structured Triage and Validation process designed to pierce through optimism and isolate the project's true economic feasibility and regulatory exposure. Beyond simple binary choices, we rigorously stress-test the exit strategy and calculate the value of informed delay—providing the analytical evidence required to determine if a venture should be accelerated, paused for critical data, radically redesigned, or abandoned to preserve capital.
At this stage, Proccium addresses the central failure mode of early-stage industrial ventures: decisions made on unpriced uncertainty. Most sponsors underestimate the interaction between technical feasibility, regulatory trajectories, balance-of-plant constraints, and capital discipline. Our role is to surface these exposures before they harden into irreversible commitments.

Structured Triage Maps. These identify binding constraints, non-compensable risks, and hidden dependences across technical, regulatory, and commercial domains.
The Mechanism: Think of this as an "Industrial X-Ray" before you pour concrete. It maps the invisible spiderweb of dependencies that hold a project together.
Consumes: Permit lists, utility grid capacities, supply chain lead times, and land-use restrictions.
Generates: A "Fatal Flaw Topology"—a visual map highlighting exactly where a delay in one domain (e.g., water permit) mathematically guarantees a failure in another (e.g., commissioning schedule).The Strategic Imperative: Projects rarely fail because of the "main thing" (e.g., the turbine works). They fail because of the "peripheral thing" (e.g., the access road isn't reinforced for the turbine's weight). Triage Mapping forces the team to look at the boring, unsexy constraints that actually kill schedules.
The Failure Mode: "The Missing Link." Teams assume someone else is checking the interface. The engineers assume the lawyers secured the land; the lawyers assume the engineers checked the soil. Triage reveals the gap between them before it becomes a lawsuit.
Practical Example: A waste-to-energy plant was technically sound but was flagged by our Triage Map because the local grid connection queue was 4 years long—2 years longer than the project's funding runway. The project was paused immediately, saving $15M in wasted development opex.
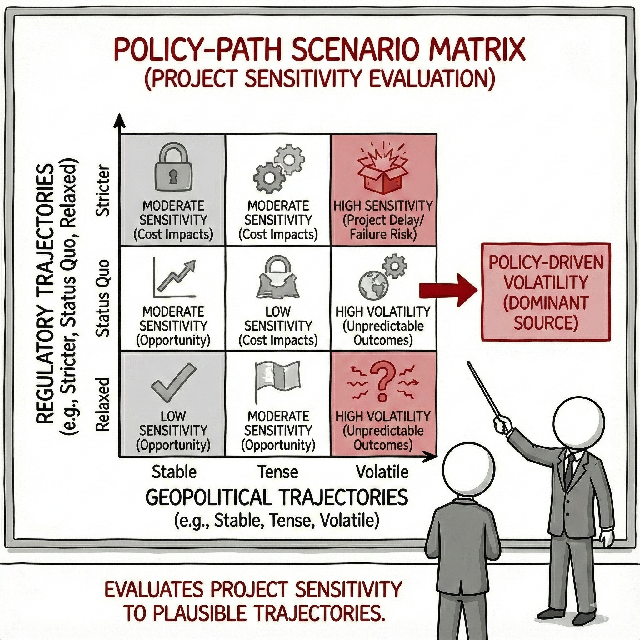
Policy-Path Scenario Matrices. We evaluate the project’s sensitivity to plausible regulatory and geopolitical trajectories—critical in sectors where policy is the dominant source of volatility.
The Mechanism: A stress-test for your business model against the whims of voters and regulators. It replaces "current law" with "future probability."
Consumes: Legislative drafts, election cycle polls, subsidy sunset clauses, and geopolitical trade-flow data.
Generates: A "Regime-Specific Valuation"—showing precisely how the project's IRR changes if the government changes, subsidies evaporate, or carbon taxes triple.The Strategic Imperative: Industrial assets last 30 years; government policies last 4. Betting your entire capital structure on a single subsidy remaining in place is not strategy; it is gambling. We identify which assets survive a hostile policy environment and which are "Regulatory Orphans."
The Failure Mode: "Subsidy Addiction." Projects often look profitable only because they assume a tax credit is permanent. When the policy wind shifts, the margin vanishes, and the asset becomes stranded.
Practical Example: A green hydrogen consortium was banking on a $3/kg production tax credit. Our matrix analysis showed that if the credit was capped (a likely political outcome), the Debt Service Coverage Ratio (DSCR) would drop below 1.0. The deal was restructured to be viable at a lower subsidy tier.
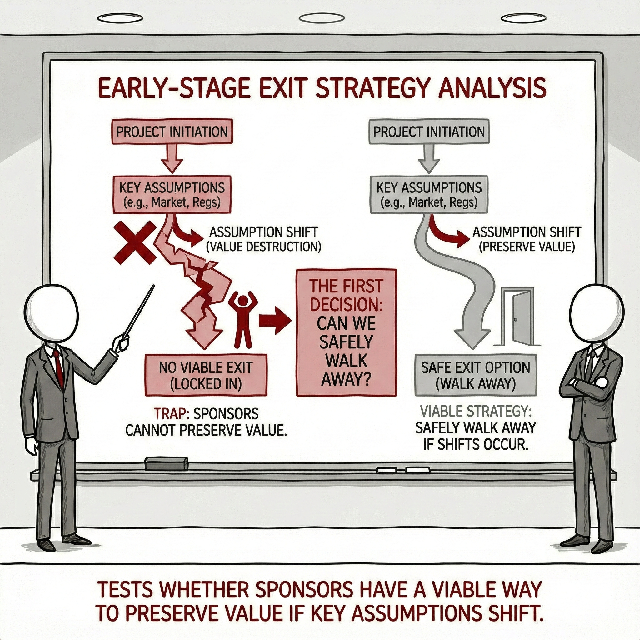
Early-Stage Exit Strategy Analysis. We test whether sponsors have a viable way to preserve value if key assumptions shift. This often reveals that the first decision is not whether to build, but whether one can safely walk away.
The Mechanism: Designing the "Eject Button" before the plane takes off. It quantifies the cost of changing your mind.
Consumes: Contract break-fees, asset liquidity (resale value), IP transferability, and joint-venture dissolution clauses.
Generates: A "Cost of Abandonment" Curve—calculating exactly how much capital is recoverable at Gate 1, Gate 2, and Gate 3.The Strategic Imperative: The most dangerous project is the one you cannot stop. If the cost of exiting is higher than the cost of finishing a bad project, you are trapped. We structure "Off-Ramps" that allow you to limit downside exposure if the market turns against you during development.
The Failure Mode: "The Sunk Cost Trap." Management teams often continue funding a failing project simply to avoid realizing a loss on the books. Without a clear, pre-calculated exit path, they throw good money after bad until the loss becomes catastrophic.
Practical Example: A chemical company entered a JV with a strict "take-or-pay" clause. Our analysis showed that exiting the deal after year 1 would cost $200M in penalties. We renegotiated a "Step-Down" break fee, lowering the exit cost to $50M, which gave the Board the confidence to sign.
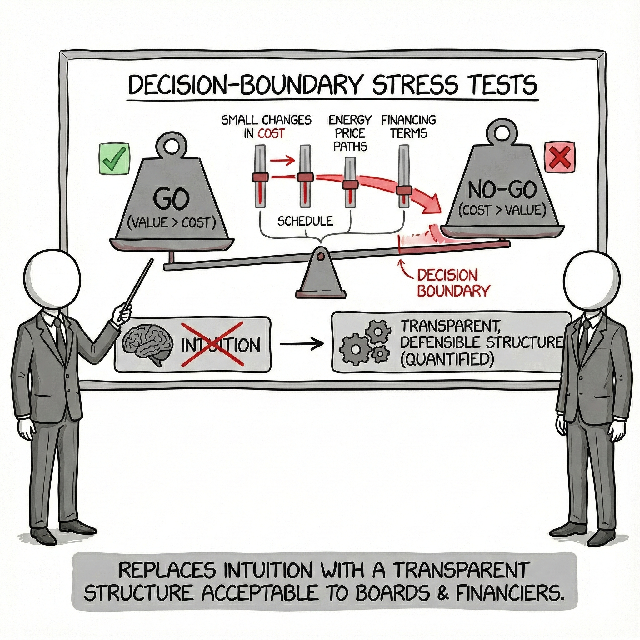
Decision-Boundary Stress Tests. We quantify how small changes in cost, schedule, or energy prices alter the go/no-go calculus. This replaces intuition with a transparent, defensible structure.
The Mechanism: Finding the "Cliff Edge." Instead of predicting where the price will be, we calculate where it cannot be.
Consumes: CAPEX/OPEX sensitivities, energy price volatility, and lender covenant thresholds.
Generates: The "Indifference Price"—the exact dollar figure (e.g., Electricity at $62/MWh) where the project NPV turns from positive to zero.The Strategic Imperative: Boards don't need point forecasts; they need Safety Margins. If a project looks great at $50 but dies at $48, it is too fragile to build. We identify the "Kill Zone"—the specific combination of events that breaks the investment case—so you can hedge against them explicitly.
The Failure Mode: "The Fragile Optimist." A project is approved based on a "Base Case" IRR of 15%. However, a mere 5% overrun in construction costs drops that IRR to 4%. The project was never robust; it was just lucky on paper.
Practical Example: A mineral processing plant was approved assuming a 90% availability factor. Our stress test showed that the bank covenants would be breached if availability dropped to 87%. Since ramp-up rarely hits 90% in year one, the financing structure was essentially pre-programmed to default.
The output is not a recommendation but a feasibility verdict that eliminates unexamined optimism. It sharply defines where the project is robust, where it is fragile, and which decisions must be delayed until the information environment improves.
2. Real Options Reasoning (The “When to Commit?”)
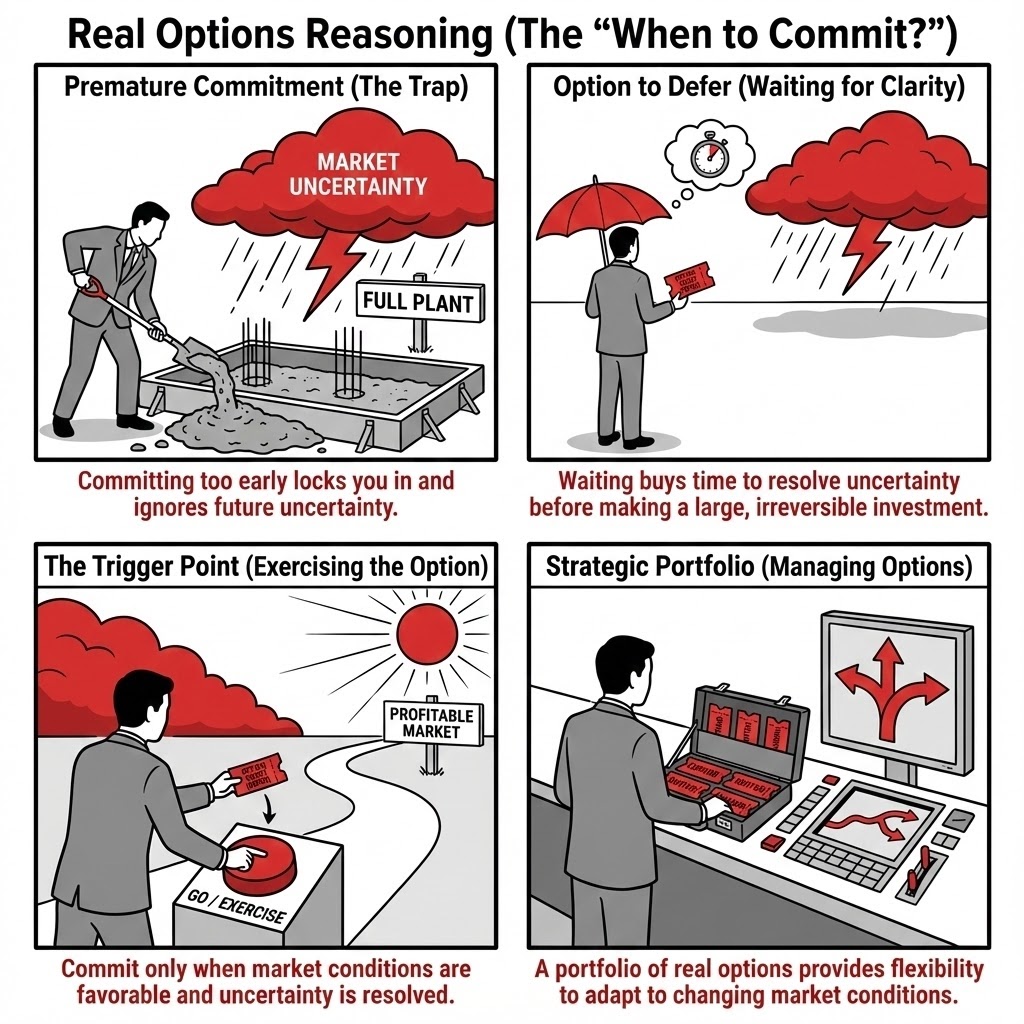
We replace the fragility of rigid, linear planning with adaptive Quantitative Decision Frameworks. Instead of relying on static "base case" forecasts, we explicitly integrate stochastic price-path uncertainty, complex system dynamics, and the potential for abrupt regulatory volatility into rigorous, audit-ready models. This transforms risk from a disclaimer into a calculated distribution, enabling us to engineer resilience against thousands of potential market and policy scenarios.
Many capital projects appear attractive only under a narrow set of assumptions about commodity prices, energy costs, carbon exposure, or permitting timelines. Once uncertainty is acknowledged as a structural characteristic rather than a disturbance, most deterministic business cases collapse under their own weight. Proccium’s role at this stage is to translate uncertainty into quantified option value that informs the timing and structure of commitment.
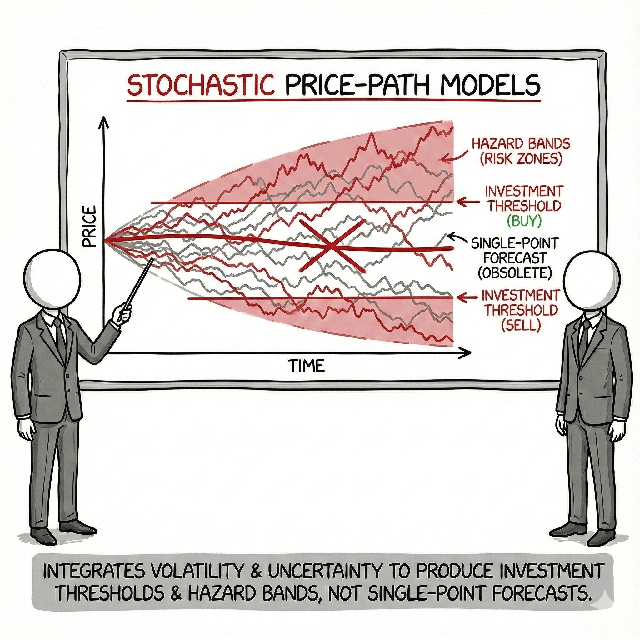
Stochastic Price-Path Models. These integrate short-term volatility with long-term trend uncertainty, producing investment thresholds and hazard bands rather than single-point forecasts.
The Mechanism: We replace the ruler with a cone. Instead of drawing a straight line for future prices, we simulate thousands of "drunkard's walks" that respect the physics of the market (mean reversion, seasonality, and spikes).
Consumes: Historical volatility, long-run marginal cost curves, and reversion speeds.
Generates: A "Probability Cone" of future prices. We tell you: "There is a 30% chance prices drop below your cash cost in Year 3. Can you survive that?"The Strategic Imperative: The average price never happens. Projects die in the troughs, not at the mean. By modeling the full volatility path, we size your liquidity buffers to survive the inevitable dips so you are still alive to capture the peaks. This is the difference between "paper value" and "bankable resilience."
The Failure Mode: "The Flaw of Averages." A gold mine might be profitable at the average price of $1,800/oz. But if the price dips to $1,400/oz for two years (a standard deviation event), the project runs out of cash and defaults before the price recovers. Standard NPV models are blind to this "path dependency."
Practical Example: A large solar developer assumed a constant annual decline in panel prices. Our stochastic model introduced supply chain volatility shocks. The result revealed that a 6-month price spike (highly probable) would wipe out the contingency budget. The client switched to a modular procurement strategy to hedge the risk.
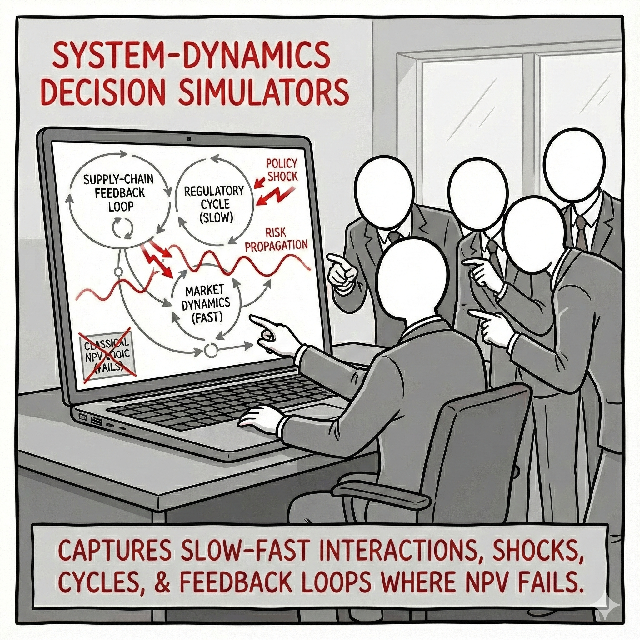
System-Dynamics Decision Simulators. These capture slow-fast interactions, policy shocks, regulatory cycles, and supply-chain feedback loops—critical where classical NPV logic fails to reflect real propagation of risk.
The Mechanism: A flight simulator for your strategy. We model the market's reaction to your project. If prices are high, competitors will build, and prices will crash. We mathematically link these feedback loops.
Consumes: Competitor pipeline data, construction lead times, and demand elasticity.
Generates: A "Boom-Bust" Simulation. It shows how the market will likely correct itself just as your project comes online.The Strategic Imperative: Static models assume the world stands still while you execute. It doesn't. High returns attract capital, which destroys returns. We help you identify "Counter-Cyclical Alpha"—timing your investment to come online when competitors are cancelling theirs, rather than joining the herd at the peak.
The Failure Mode: "The Hog Cycle Trap." Everyone sees high lithium prices, so everyone builds a mine. Five years later, they all open simultaneously, crashing the price. System Dynamics predicts this saturation; Excel does not.
Practical Example: A hydrogen investor planned to scale up based on current high gas prices. Our simulation showed that high gas prices would trigger a massive build-out of renewables, eventually crashing electricity prices and altering the hydrogen competitive landscape. The client pivoted to a flexible feedstock technology.
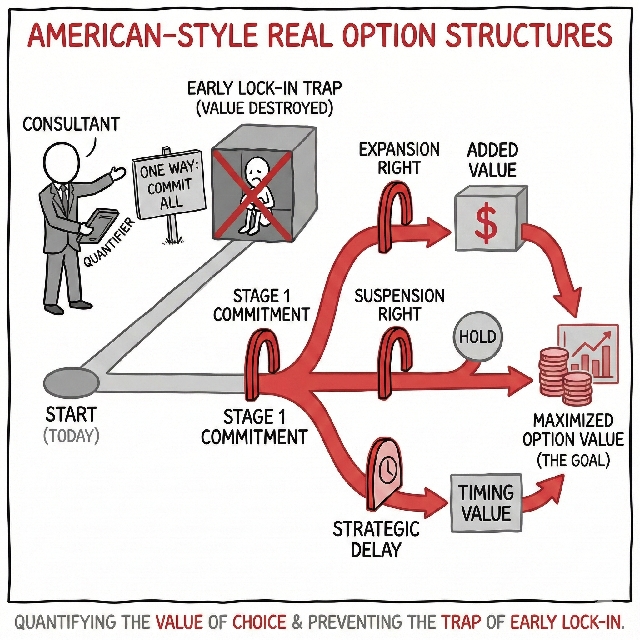
American-Style Real Option Structures. We quantify the value of staged commitments, expansion rights, and suspension rights. We identify where optionality is mispriced or unintentionally destroyed by early lock-in.
The Mechanism: Valuing the "Right to Choose." Standard finance treats flexibility as zero value. We value it using option lattices. An "American" option means you can act at any time, not just at the end.
Consumes: Volatility of the underlying asset, cost to switch/expand, and the "holding cost" of waiting.
Generates: The Dollar Value of Flexibility. We prove that paying $10M extra for a modular plant design actually adds $50M in risk-adjusted value because it allows you to stop spending if the market turns.The Strategic Imperative: In high-volatility markets, flexibility is the ultimate asset. The ability to pause construction, switch fuels, or expand modularly allows you to "harvest" volatility—gaining from the upside while capping the downside. We mathematically prove that rigid "economies of scale" are often "diseconomies of rigidity."
The Failure Mode: "The Megaproject Monolith." Building one giant plant to save 5% on CAPEX destroys the option to stop. If the market shifts halfway through construction, you are forced to finish a bad project. A modular approach preserves the option to abandon, protecting equity.
Practical Example: An oil major was debating a $2B platform vs. a series of $500M tie-backs. The big platform had a higher base NPV. Our Real Options analysis showed the tie-back strategy was worth $300M more because it allowed the firm to stop investing if oil dropped below $60—a valuable insurance policy the big platform lacked.

Commitment-Fitness Maps. We assess how resilient the project is against plausible changes in price trajectories or policy frameworks. These maps clarify when commitment is value-creating and when delay preserves capital.
The Mechanism: The "Traffic Light" for Capital Deployment. It is a heat map of decision quality.
Consumes: The current "State of the World" (prices, rates, policy) and the Option Value of Waiting (Value of Information).
Generates: A Visual Territory Map. "Green Zone": Commit immediately—the cost of delay exceeds the benefit of information. "Red Zone": Wait—volatility is too high, and the option to wait is more valuable than the project cash flow.The Strategic Imperative: The most common error in strategy is "Premature Commitment." Managers feel pressure to "do something." We quantify the "Value of Waiting." Sometimes, paying $1M/year to hold a permit option is statistically smarter than sinking $100M into a volatile market. We give you the math to defend "doing nothing" as an active strategic choice.
The Failure Mode: "Fear of Missing Out (FOMO)." Competitors are building, so we must build. This herd mentality ignores that the "Second Mover Advantage" often comes from waiting for technology to de-risk or costs to stabilize.
Practical Example: A data center developer wanted to rush a build in a constrained grid area. Our Fitness Map showed that waiting 12 months for a regulatory ruling on grid fees had a "Value of Information" of $40M. They waited, the ruling was favorable, and they saved huge connection fees that their rushing competitors got locked into.
The outcome is a decision-ready commitment strategy that replaces intuition with defensible, board-level analytics. We clarify when the project should be committed, under which boundary conditions, and how to maintain flexibility if the external environment diverges from expectations.
3. Execution Reality Check (The “Can We Sustain It?”)
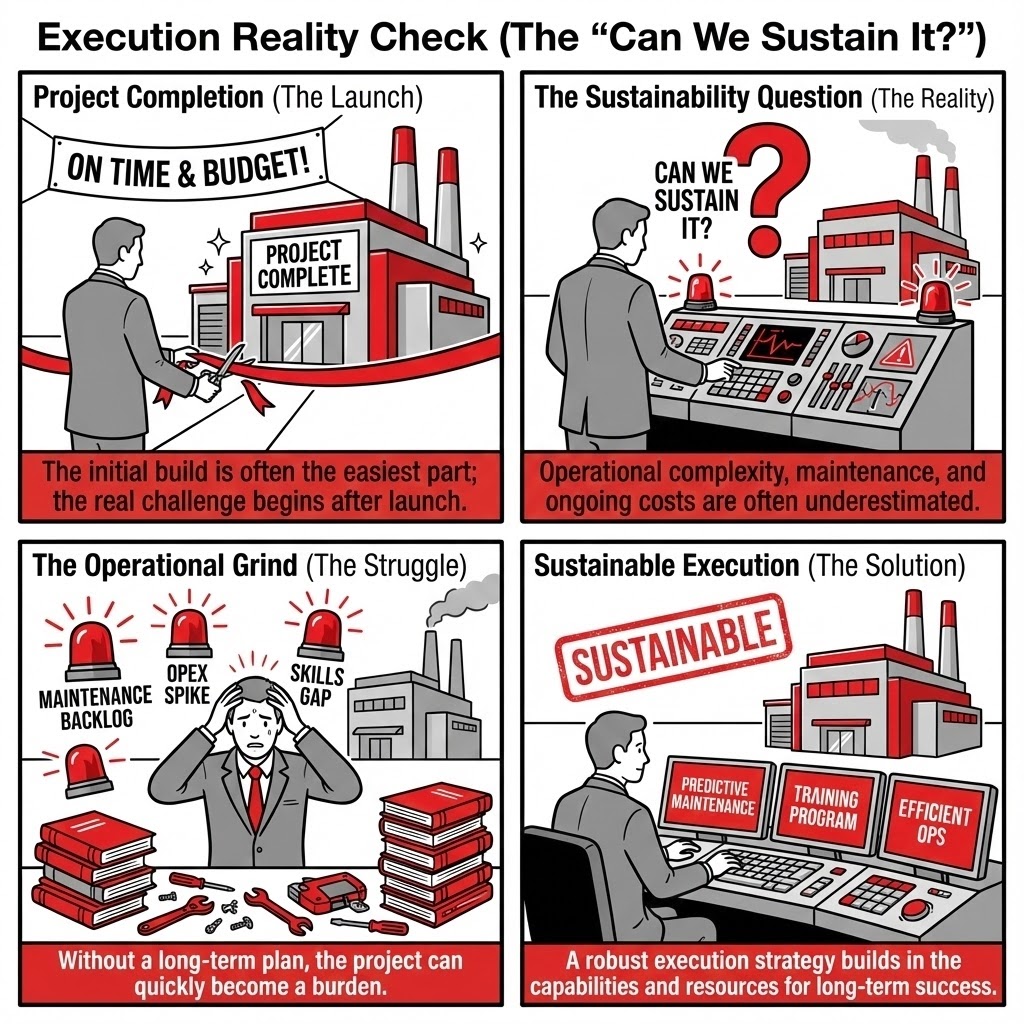
We systematically challenge the entrenched institutional optimism that fuels subtle scope inflation and chronically underestimated execution risk. We ensure that high-level strategic intent is rigorously translated into simple, robust project architectures, stripping away unnecessary complexity to avoid typical capital escalation patterns and ensuring the design fully accounts for real-world operability.
Execution failure rarely originates in engineering errors. It emerges from structural fragilities in governance, decision rights, and incentive alignment—issues that remain invisible until the first deviation occurs. Sponsors often enter execution with a design that is operable on paper but unsustainable in the real institutional, contractual, and policy environment. Proccium’s role is to expose these fragilities before they lock into schedule and cost.
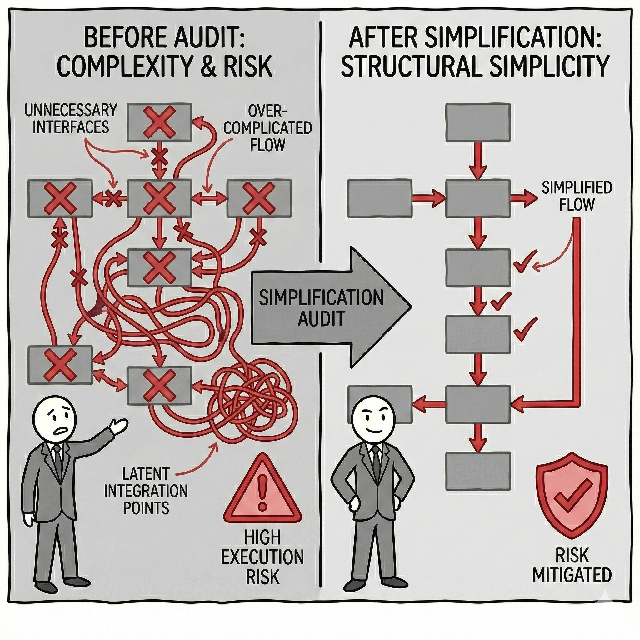
Architecture Simplification Audits. These identify unnecessary interfaces, over-complicated process flows, and latent integration points where coordination costs compound. We prove that structural simplicity is the strongest form of risk mitigation.
The Mechanism: We treat complexity as a tax. We review the Project Execution Plan (PEP) and technical flowsheets to count the "handshakes."
Consumes: Interface registers, contractor scope splits, and process flow diagrams.
Generates: A "Complexity Reduction Roadmap." We red-line the plan: "Merge these two contracts," "Delete this bypass loop," "Remove this approval layer."The Strategic Imperative: Complexity grows non-linearly. A project with 10 interfaces is not twice as hard as one with 5; it is ten times harder. We aggressively prune the "Nice-to-Haves" and engineering "Gold-Plating" that add friction without adding value. The goal is a project that is robust because it is simple.
The Failure Mode: "Conway’s Law." Organizations design systems that mirror their own messy communication structures. You end up with a plant that requires three different vendors to agree before a valve can be turned. When something breaks, everyone points fingers, and the plant stays down.
Practical Example: A biomass plant had split the "Fuel Handling" and "Boiler" scopes between two EPCs to "save money." Our audit showed the interface risk (who dries the wood?) would cause disputes. We advised merging the scope into a single point of responsibility. The client ignored the advice, and the project later stalled for 8 months in litigation over moisture content specs.
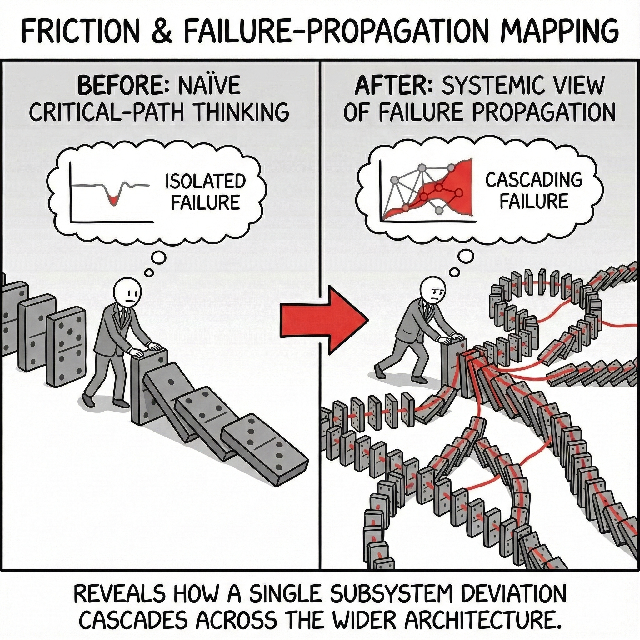
Friction and Failure-Propagation Mapping. We evaluate how deviations in one subsystem cascade across the wider project. This replaces naïve critical-path thinking with a systemic view of failure propagation.
The Mechanism: We model the "Butterfly Effect" in your schedule. We link seemingly unrelated risks to see how they infect each other.
Consumes: Logistics routes, weather windows, labor availability curves, and permit sequences.
Generates: A "Contagion Map." It reveals: "A 2-week delay in the port permit pushes the heavy lift transport into the monsoon season, which delays the foundation by 4 months."The Strategic Imperative: The Critical Path is a static fiction. In reality, delays are contagious. A small slip in a non-critical item (e.g., camp housing) can degrade labor productivity, eventually destroying the critical path. We identify these "Hidden Vectors" so you can firewall them before execution starts.
The Failure Mode: "Siloed Optimism." The Port Manager says, "It's only a week late." The Construction Manager says, "I have float." Neither realizes that their combined deviation triggers a contractual penalty clause that wipes out the project's profit margin.
Practical Example: An offshore wind farm treated "Cable Laying" and "Turbine Installation" as separate risks. Our mapping showed that if the cables were late, the turbine vessel would be idling at $200k/day. We forced the project to decouple the schedules using pre-installed wet-storage, paying a small premium to insure against a $20M delay risk.
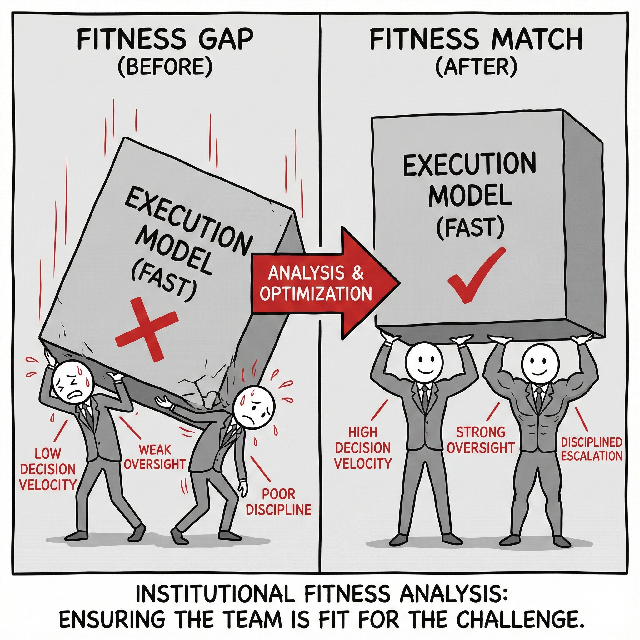
Institutional Fitness Analysis. We test whether the organisation—and its partners—possess the decision velocity, oversight capability, and escalation discipline required for the chosen execution model.
The Mechanism: A stress test for your Org Chart. We ask: "Who decides, and how fast?"
Consumes: Delegation of Authority (DoA) matrices, steering committee minutes, and partner capability assessments.
Generates: A "Governance Velocity Score." We predict if your current decision structure is fast enough to keep up with the burn rate of the construction site.The Strategic Imperative: You cannot run a billion-dollar project with a "Mom and Pop" decision structure. Delay costs money. If a Change Order takes 6 weeks to sign because it needs Board approval, the contractor will de-mobilize. We align your decision rights with the "Clock Speed" of the project.
The Failure Mode: "The Empty Suit." The project director has a fancy title but no check-signing authority. Every minor issue goes up to a distracted Board, creating a decision bottleneck. The project dies not from bad engineering, but from slow bureaucracy.
Practical Example: A Joint Venture was set up with a requirement for unanimous board approval on all spending over $50k. We flagged this as a fatal flaw for a $500M build. The client restructured the DoA to allow the Project Director autonomy up to $5M, preventing the site from grinding to a halt over minor concrete variances.
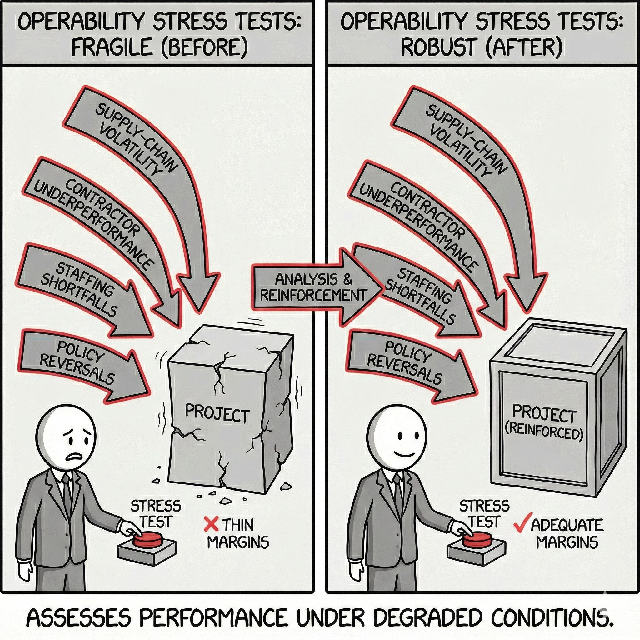
Operability Stress Tests. We assess performance under degraded conditions—supply-chain volatility, staffing shortfalls, or policy reversals. These tests reveal structural margins that are either robust or dangerously thin.
The Mechanism: We crash-test the business model. We simulate " The Bad Day."
Consumes: Minimum turndown rates, spare parts inventory, operator skill requirements, and reagent supply volatility.
Generates: An "Operational Fragility Index." It tells you: "This plant prints money at 100% capacity, but loses money if it runs at 80% or if one key engineer calls in sick."The Strategic Imperative: Engineers design for the "Design Point" (perfect conditions). Owners must live in the real world. A plant that is too complex to run, or too fragile to turn down during low demand, is a liability. We ensure the asset is "Anti-Fragile"—capable of making money even when things go wrong.
The Failure Mode: "The Glass Cannon." A facility is optimized for maximum theoretical efficiency but has zero operational flex. A minor supply chain disruption (e.g., missing a specific chemical reagent) shuts the whole facility down because there is no bypass mode.
Practical Example: A recycling plant was designed to be fully automated to save headcount. Our stress test asked, "What if the sensors fail?" The answer was a total shutdown. We mandated the installation of manual override stations and a training program for manual operation, ensuring business continuity during inevitable software glitches.
The output is a realistic, institutionally aligned execution architecture. We ensure the project can sustain stress, absorb deviation, and maintain coherence from FID through commissioning—long after the slide deck has been forgotten.
4. Strategic Peripheral Vision (The “What Are We Missing?”)
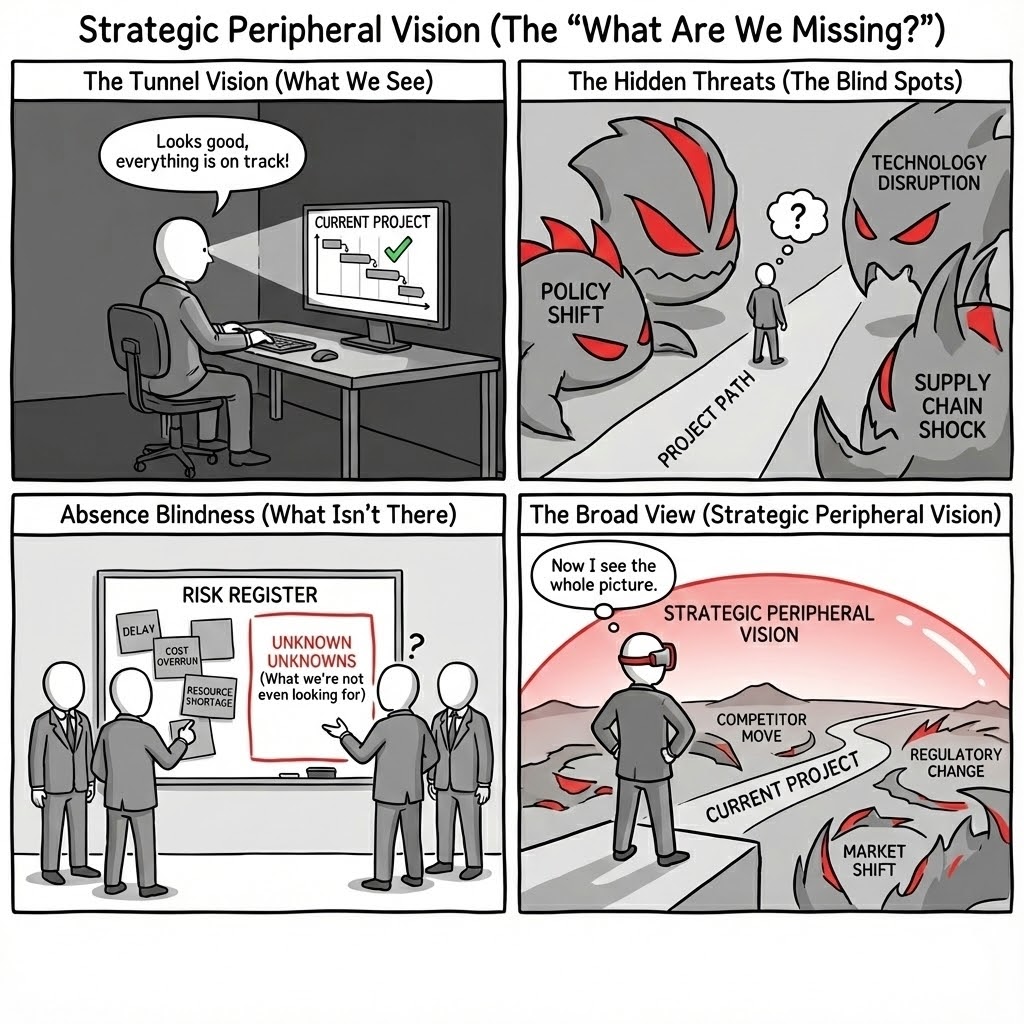
Project teams naturally develop tunnel vision, focusing intensely on the variables inside the fence-line while ignoring the existential threats and opportunities outside it. We systematically scan for Absence Blindness, Indirect Exposure, and Opportunity Cost—forcing the organization to confront the invisible counterfactuals and second-order effects that standard risk registers miss.
The most dangerous risks are not the ones you miscalculate; they are the ones you do not even put on the spreadsheet. We deploy a "Red Team" methodology to broaden the aperture of risk analysis, ensuring that your project is robust not just to internal error, but to external chaos and better alternatives.

Counterfactual & Opportunity Cost Modeling. We quantify the "Road Not Taken." Most business cases compare the project to "Doing Nothing." We compare it to the "Next Best Alternative"—revealing whether locking up capital in this asset actually destroys value compared to a more flexible strategy.
The Strategic Imperative: Capital is finite. Every dollar spent on Project A is a dollar denied to Project B. We rigorously model the Opportunity Cost. Is building a new plant actually better than debottlenecking five old ones? Is owning the asset better than a long-term lease? We prevent "Project Momentum" from crowding out superior capital allocation.
The Failure Mode: "The Tunnel Vision Trap." A team falls in love with a Green Hydrogen project because it has a positive IRR. They fail to notice that a simple Electrification project has a higher IRR with lower risk. They commit to the "Good" project and miss the "Great" one.
Practical Example: A utility was about to sign a $500M EPC contract for a new peaker plant. Our counterfactual analysis showed that a portfolio of grid-scale batteries and demand-response contracts provided the same capacity at 80% of the cost and 10% of the execution risk. The project was cancelled; the capital was redeployed.

Indirect Exposure & Correlation Mapping. We identify hidden exposure to "safe" variables. Your project might look independent, but if your supplier, your customer, and your insurer are all exposed to the same macro-factor (e.g., interest rates), you have a single point of failure.
The Strategic Imperative: Modern supply chains create "invisible threads" of risk. We map the second-and-third-order effects. Does a drought in Brazil affect your bauxite supply in Australia? Does a chip shortage in Taiwan delay your truck fleet in Texas? We expose the fragility of the ecosystem surrounding your project.
The Failure Mode: "The Domino Blindspot." The project manager confirms the concrete is contracted at a fixed price. He misses that the concrete supplier relies on a single quarry that is currently facing a permit challenge. When the quarry closes, the "fixed price" contract becomes worthless force majeure paper.
Practical Example: A solar developer felt secure with "Tier 1" panel suppliers. Our mapping showed that all three "independent" suppliers sourced their polysilicon from the same region in China, which was facing potential trade sanctions. We forced a diversification of the sub-supply chain before Financial Close.

Absence Blindness & "Unknown Unknowns" Scans. We systematically look for what is missing from the risk register. We use "Pre-Mortem" workshops and historical reference class data to force the team to imagine failure modes they have never experienced.
The Strategic Imperative: Humans are terrible at imagining things they haven't seen. We suffer from "What You See Is All There Is" (WYSIATI). We act as the institutional memory of failure. We inject "exogenous shocks" into the planning process—pandemics, blockades, hyperinflation—testing if the project has the liquidity buffers to survive the unimaginable.
The Failure Mode: "The Black Swan Surprise." A risk register lists 50 risks, all titled "Delay in X" or "Cost increase in Y." It completely misses "Civil Unrest," "Cyber Ransomware," or "Retroactive Tax Change." When these hit, there is no contingency plan, and panic ensues.
Practical Example: A cross-border pipeline project had a perfect technical risk register but no mention of "Sovereign Debt Default" in the host country. We raised this "Unknown Unknown." Six months later, the host currency collapsed, triggering capital controls that would have trapped all project revenue. The structure was preemptively altered to offshore escrow accounts.

Technical Lock-In Audits. We assess the "Cost of Reversibility." We identify decisions that act as one-way doors (e.g., proprietary software, non-standard rail gauges) and challenge whether the benefit justifies the loss of future strategic freedom.
The Strategic Imperative: In a rapidly evolving technology landscape, flexibility is valuable. Locking into a proprietary technology stack today might save 5% CAPEX but cost 50% OPEX in five years when the vendor monopolizes upgrades. We fight for open standards and modular interfaces to preserve your future bargaining power.
The Failure Mode: "The Vendor Prison." A technology provider offers a discount on equipment in exchange for a long-term service agreement. The project team takes the CAPEX saving to meet budget. Five years later, the service costs spiral, and the "cheap" equipment cannot run without the vendor's proprietary code.
Practical Example: A mining automation project was selecting a fleet management system. Vendor A was cheaper but closed-source; Vendor B was open-API. We demonstrated that Vendor A's system would prevent the mine from adopting future AI tools from other startups. The client chose Vendor B, preserving the "Option to Innovate."
The result is a project that is not just optimized for the central case, but hardened against the periphery. We ensure you are not blindsided by the risks everyone ignored because they "weren't in the scope."
The Engine Room: Quantitative Rigour
Strategic judgment must be backed by computational truth. Proccium operates on financial models designed with full referential integrity and multi-dimensional stochastic realism. We do not rely on static spreadsheets; we build audit-ready simulation engines that make underlying assumptions explicit and traceable.
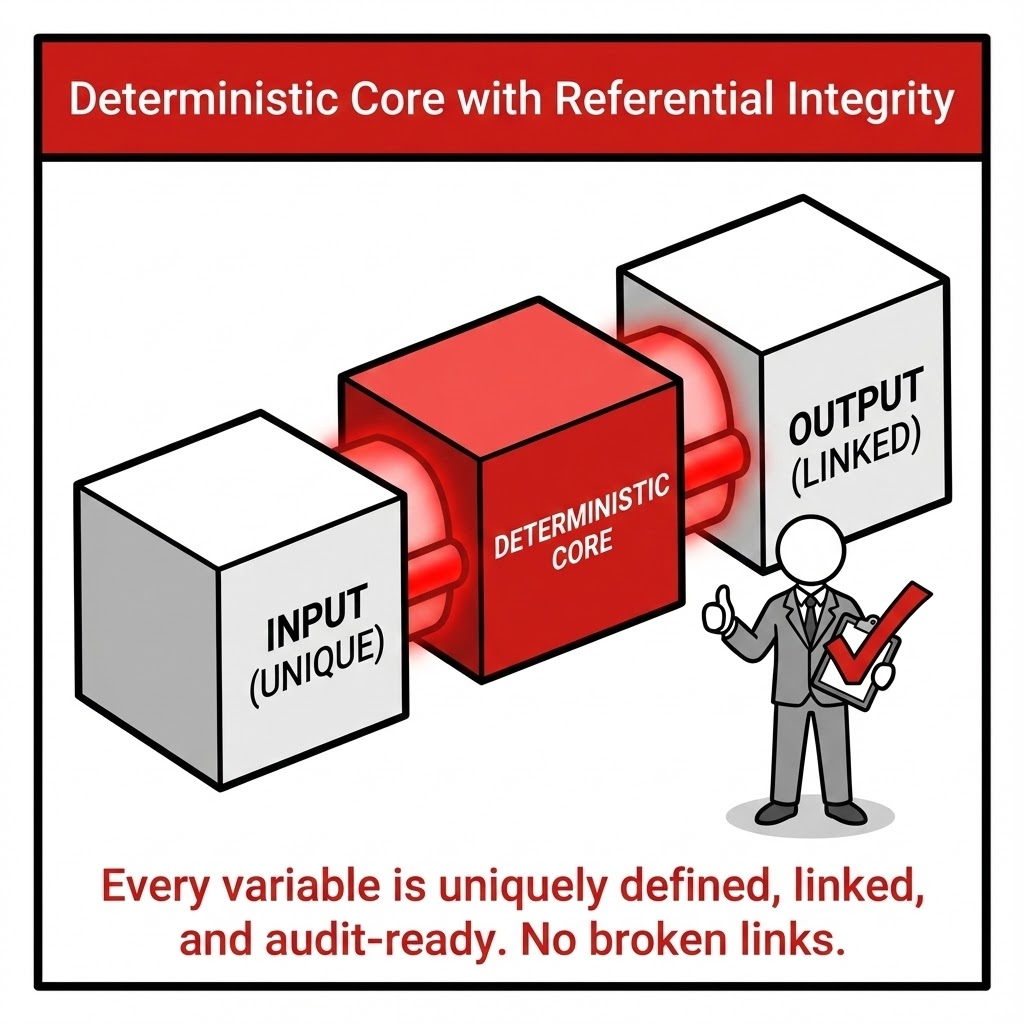
Deterministic Core with Referential Integrity. We ensure every variable is uniquely defined, internally consistent, and audit-ready. We eliminate "spaghetti logic" and hard-coded values to create models that stand up to the most rigorous external audit.
The Strategic Imperative: In project finance, a model is not a calculator; it is a contract. "Referential Integrity" means there is a Single Source of Truth. If the inflation assumption changes in the Macro tab, it must instantly and correctly propagate to OPEX, CAPEX escalation, and debt service coverage ratios without manual intervention. This allows for rapid, confident negotiation in the boardroom.
The Failure Mode: "The Hard-Code Virus." Analysts often type numbers (like
*1.05) directly into formulas to "make it work." When assumptions change later, these hidden numbers remain fixed, creating invisible errors. We have seen billion-dollar valuations swing by 15% due to a single hard-coded tax rate buried in a sub-schedule.Practical Example: During the due diligence for a pipeline acquisition, the buyer’s audit team found that the "Fuel Cost" line didn’t update when the "Oil Price" input was changed. The seller had hard-coded a value to fix a circular reference. Trust evaporated, and the deal price was chipped by $30M as a "Model Risk Premium."
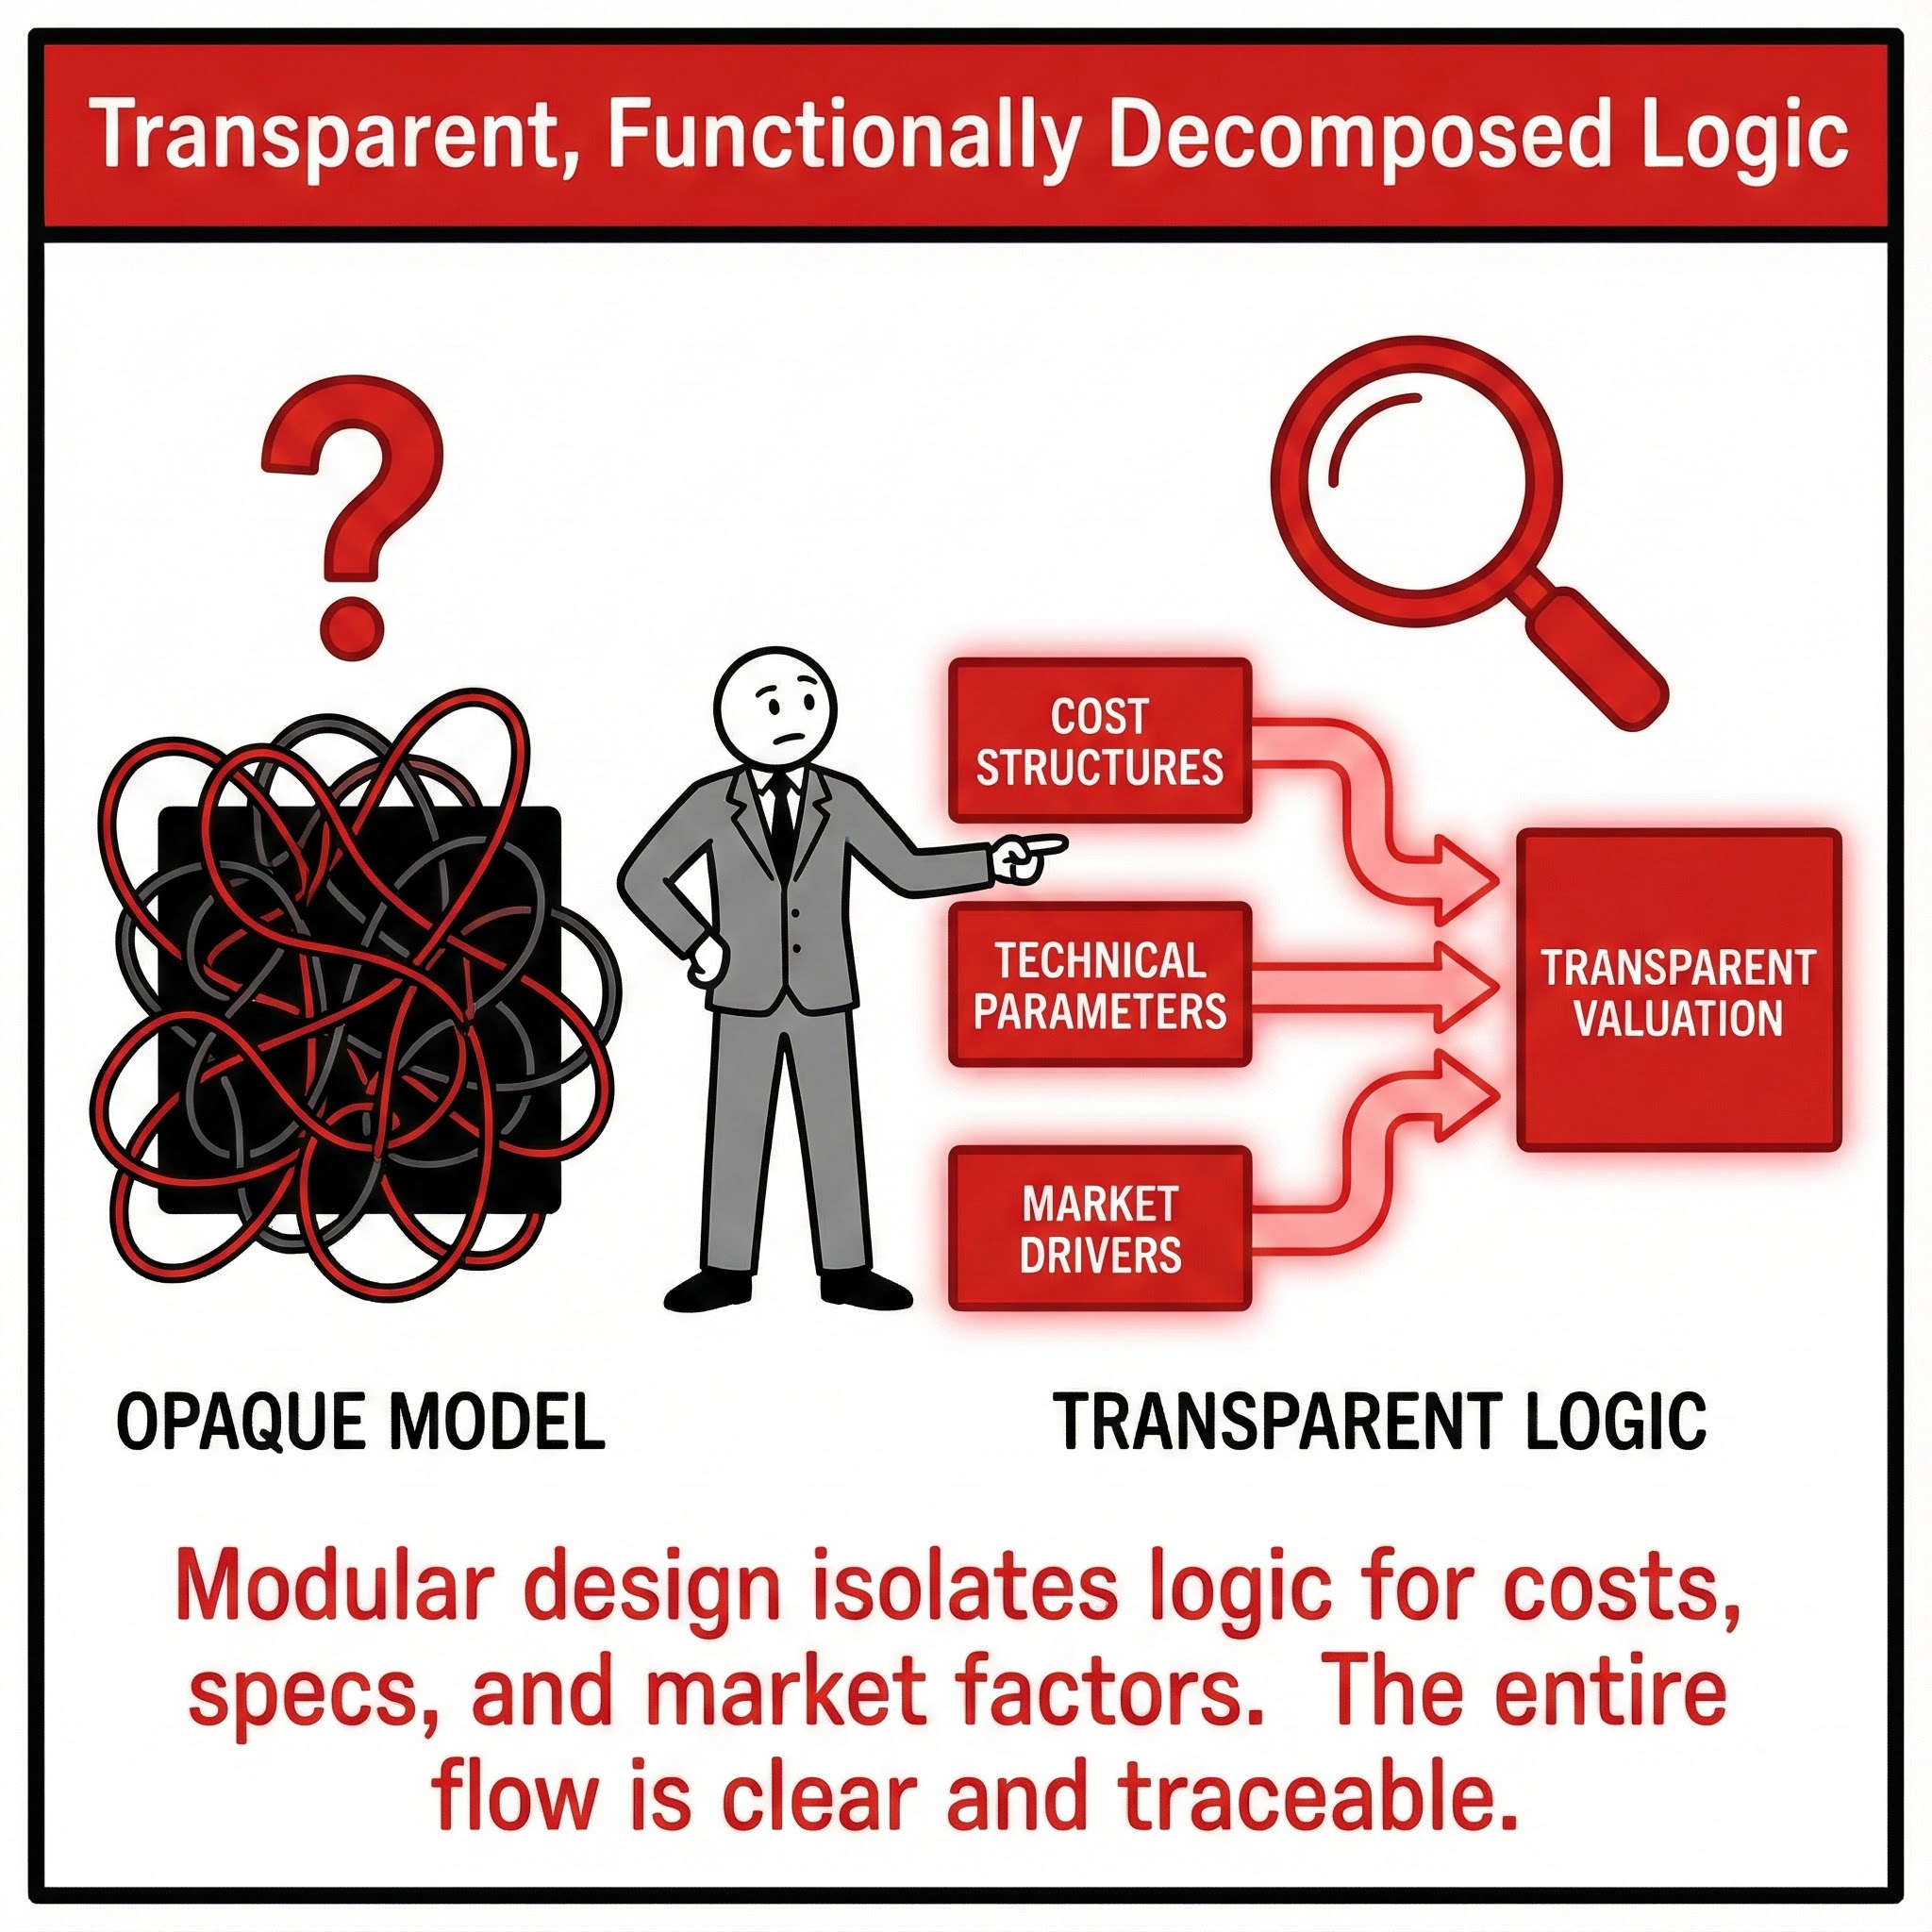
Transparent, Functionally Decomposed Logic. We treat the financial model as a system of interacting components, not a monolithic spreadsheet. We isolate cost structures, technical parameters, and market drivers to manage complexity.
The Strategic Imperative: Complexity is the enemy of execution. We apply software engineering principles ("Separation of Concerns") to financial modeling. We keep the "Physics" (mass balance) separate from the "Economics" (prices) and the "Finance" (debt structure). This modularity allows us to swap out a debt tranche or update a process technology without breaking the entire valuation logic.
The Failure Mode: "The Black Box." When logic is opaque, stakeholders cannot verify it. If a CEO asks, "Why did NPV drop?", and the analyst cannot trace the cause in 2 minutes, the model is useless for governance. Opaque models hide critical flaws (like double-counting inflation) that only surface when cash runs out.
Practical Example: A renewable developer missed a tax equity deadline because their model couldn't handle a "flip structure" without a total rebuild. Our modular approach allows for "plug-and-play" financing logic, enabling the client to test three different equity structures in a single afternoon.
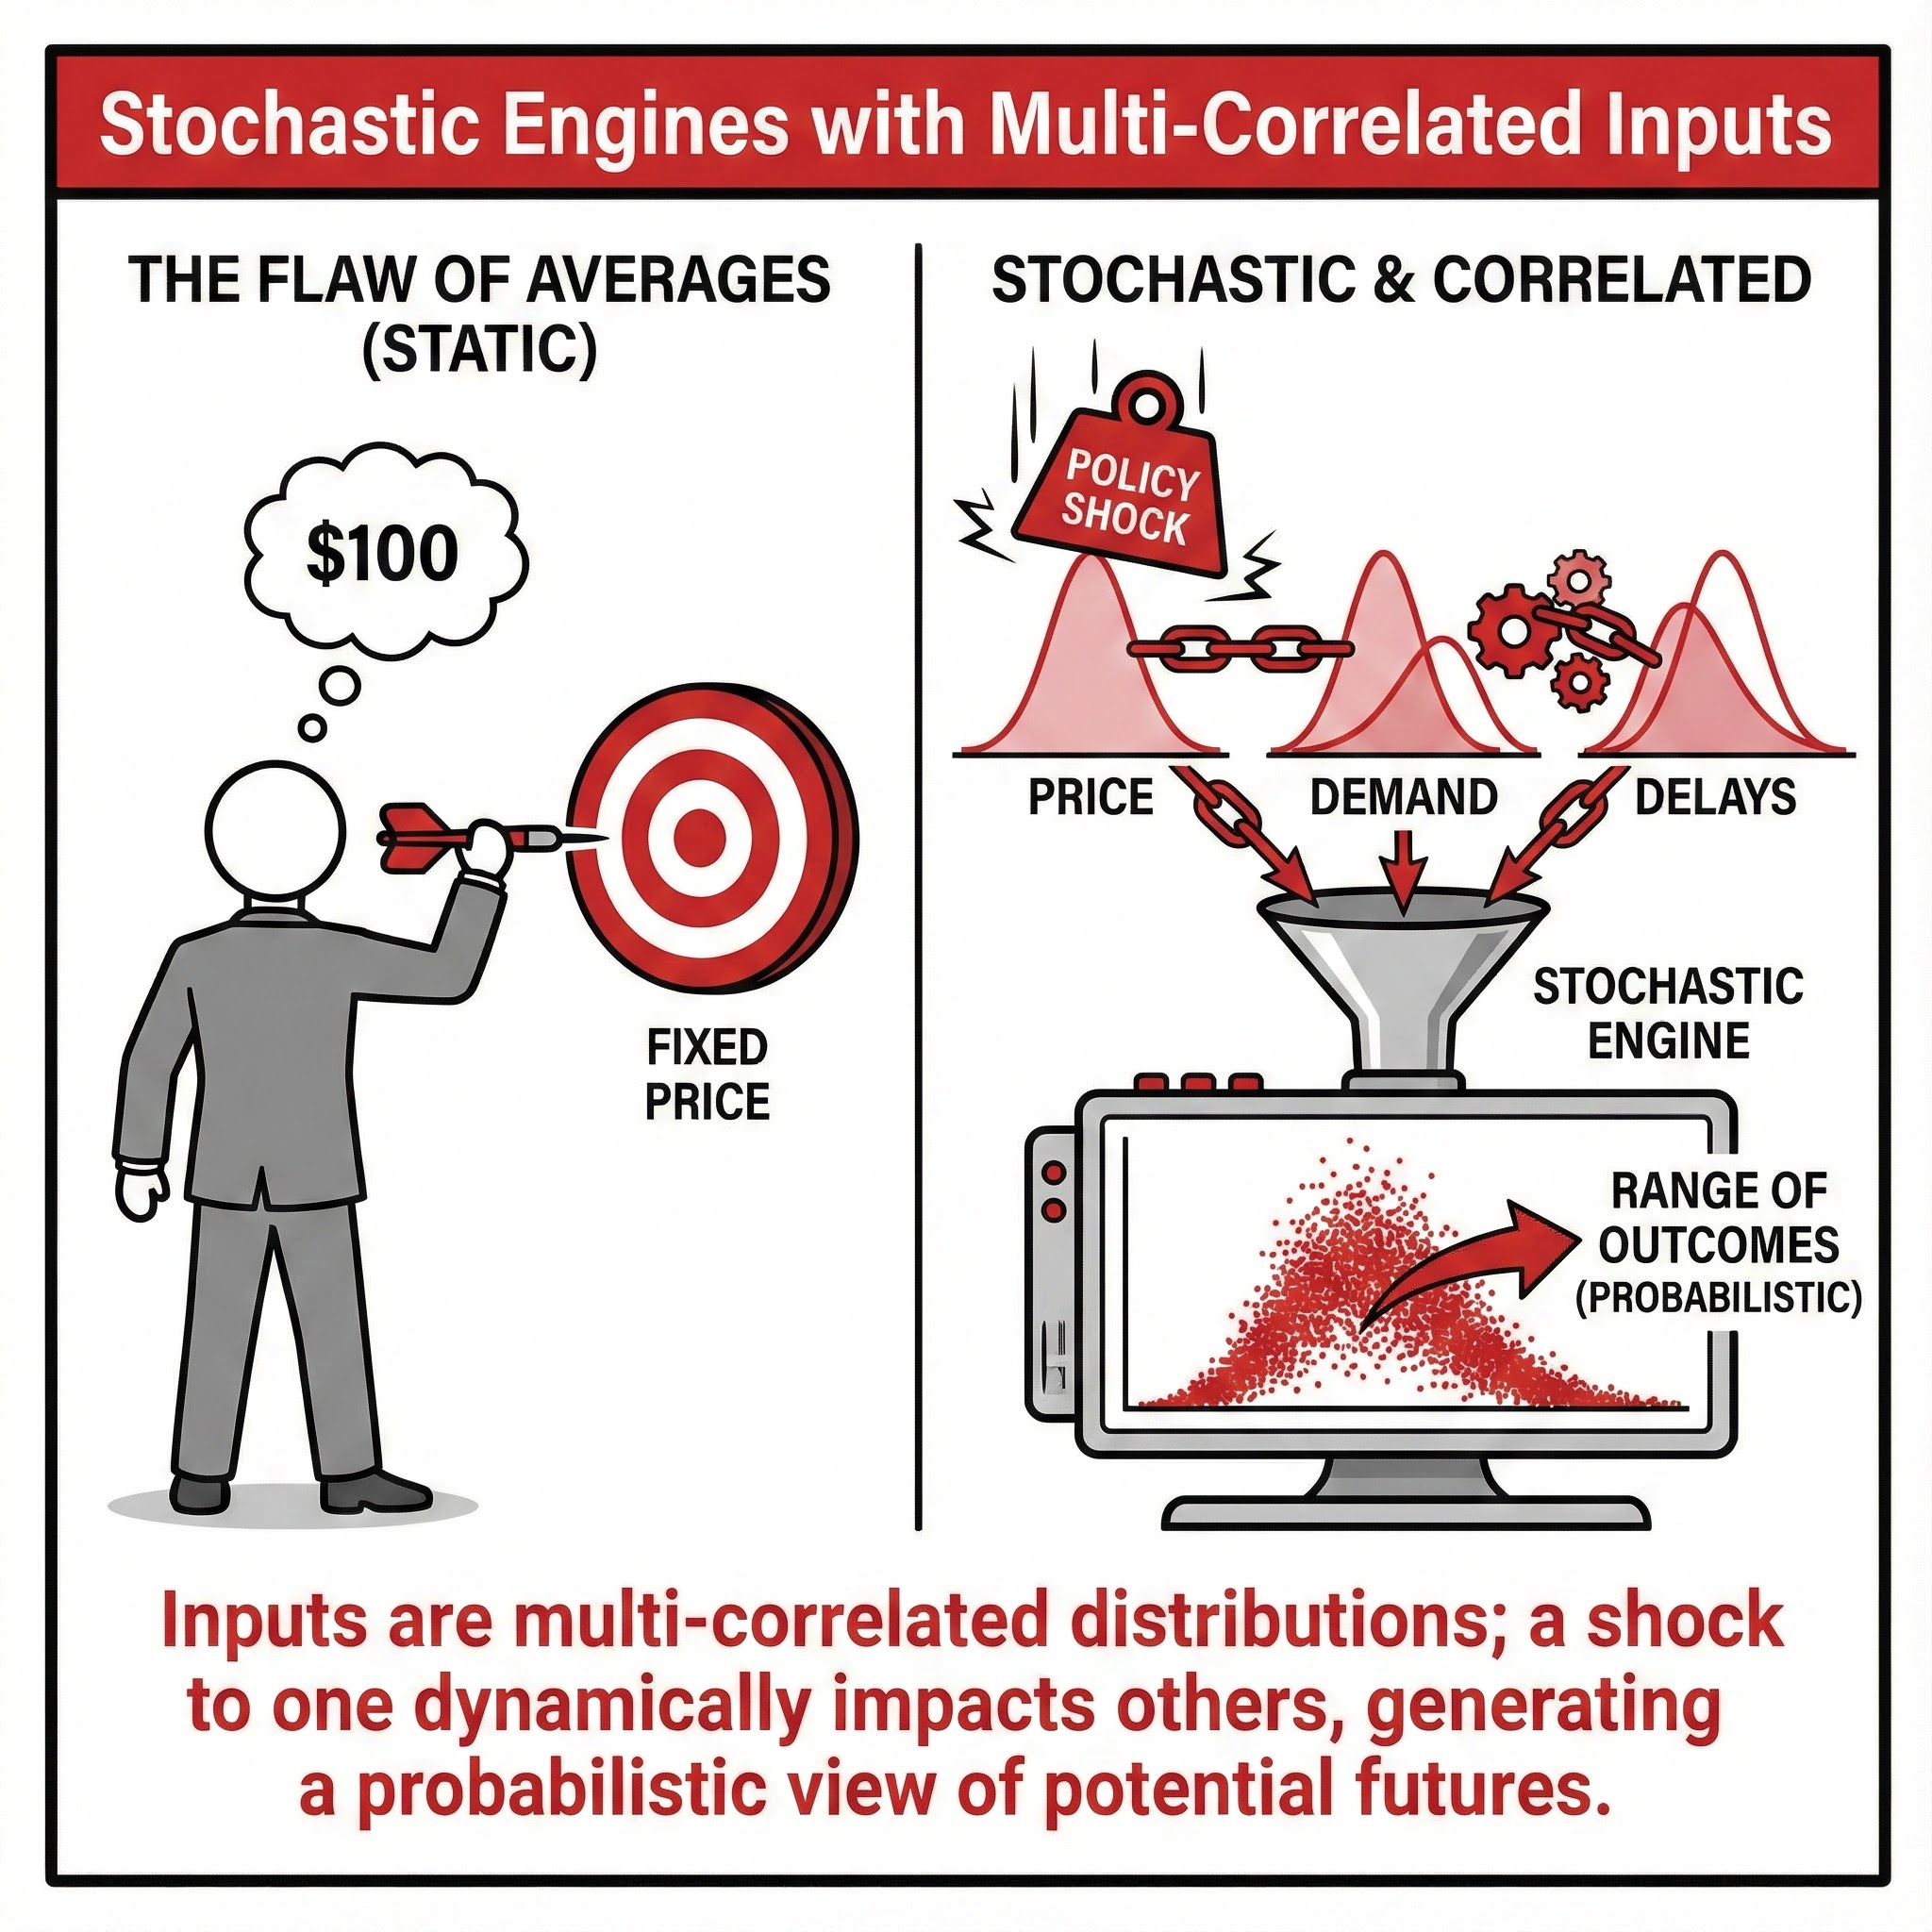
Stochastic Engines with Multi-Correlated Inputs. We replace static assumptions with dynamic probability distributions that reflect the messy reality of industrial markets, capturing the joint dynamics of prices, demand, and shocks.
The Strategic Imperative: Markets move in clusters, not straight lines. High energy prices often correlate with high inflation and specific currency moves. A robust model must capture this "Joint Probability." We use statistical Copulas to ensure that when the model simulates a shock in Variable A, it correctly simulates the associated stress in Variable B, testing the structural integrity of your hedge.
The Failure Mode: "The Flaw of Averages." A mining project looked profitable using average copper prices and average energy costs. But in reality, high energy costs (which hurt margins) often coincide with low copper demand (recessions). By modeling averages, the sponsor missed the "Correlation Trap" where costs rise exactly when revenue falls.
Practical Example: An airline hedged fuel but not currency. Our stochastic analysis showed that in 80% of "High Oil Price" scenarios, the local currency also devalued, compounding the pain. We forced a redesign of the hedging strategy to cover the "Total Cost of Ownership" risk, not just the commodity component.
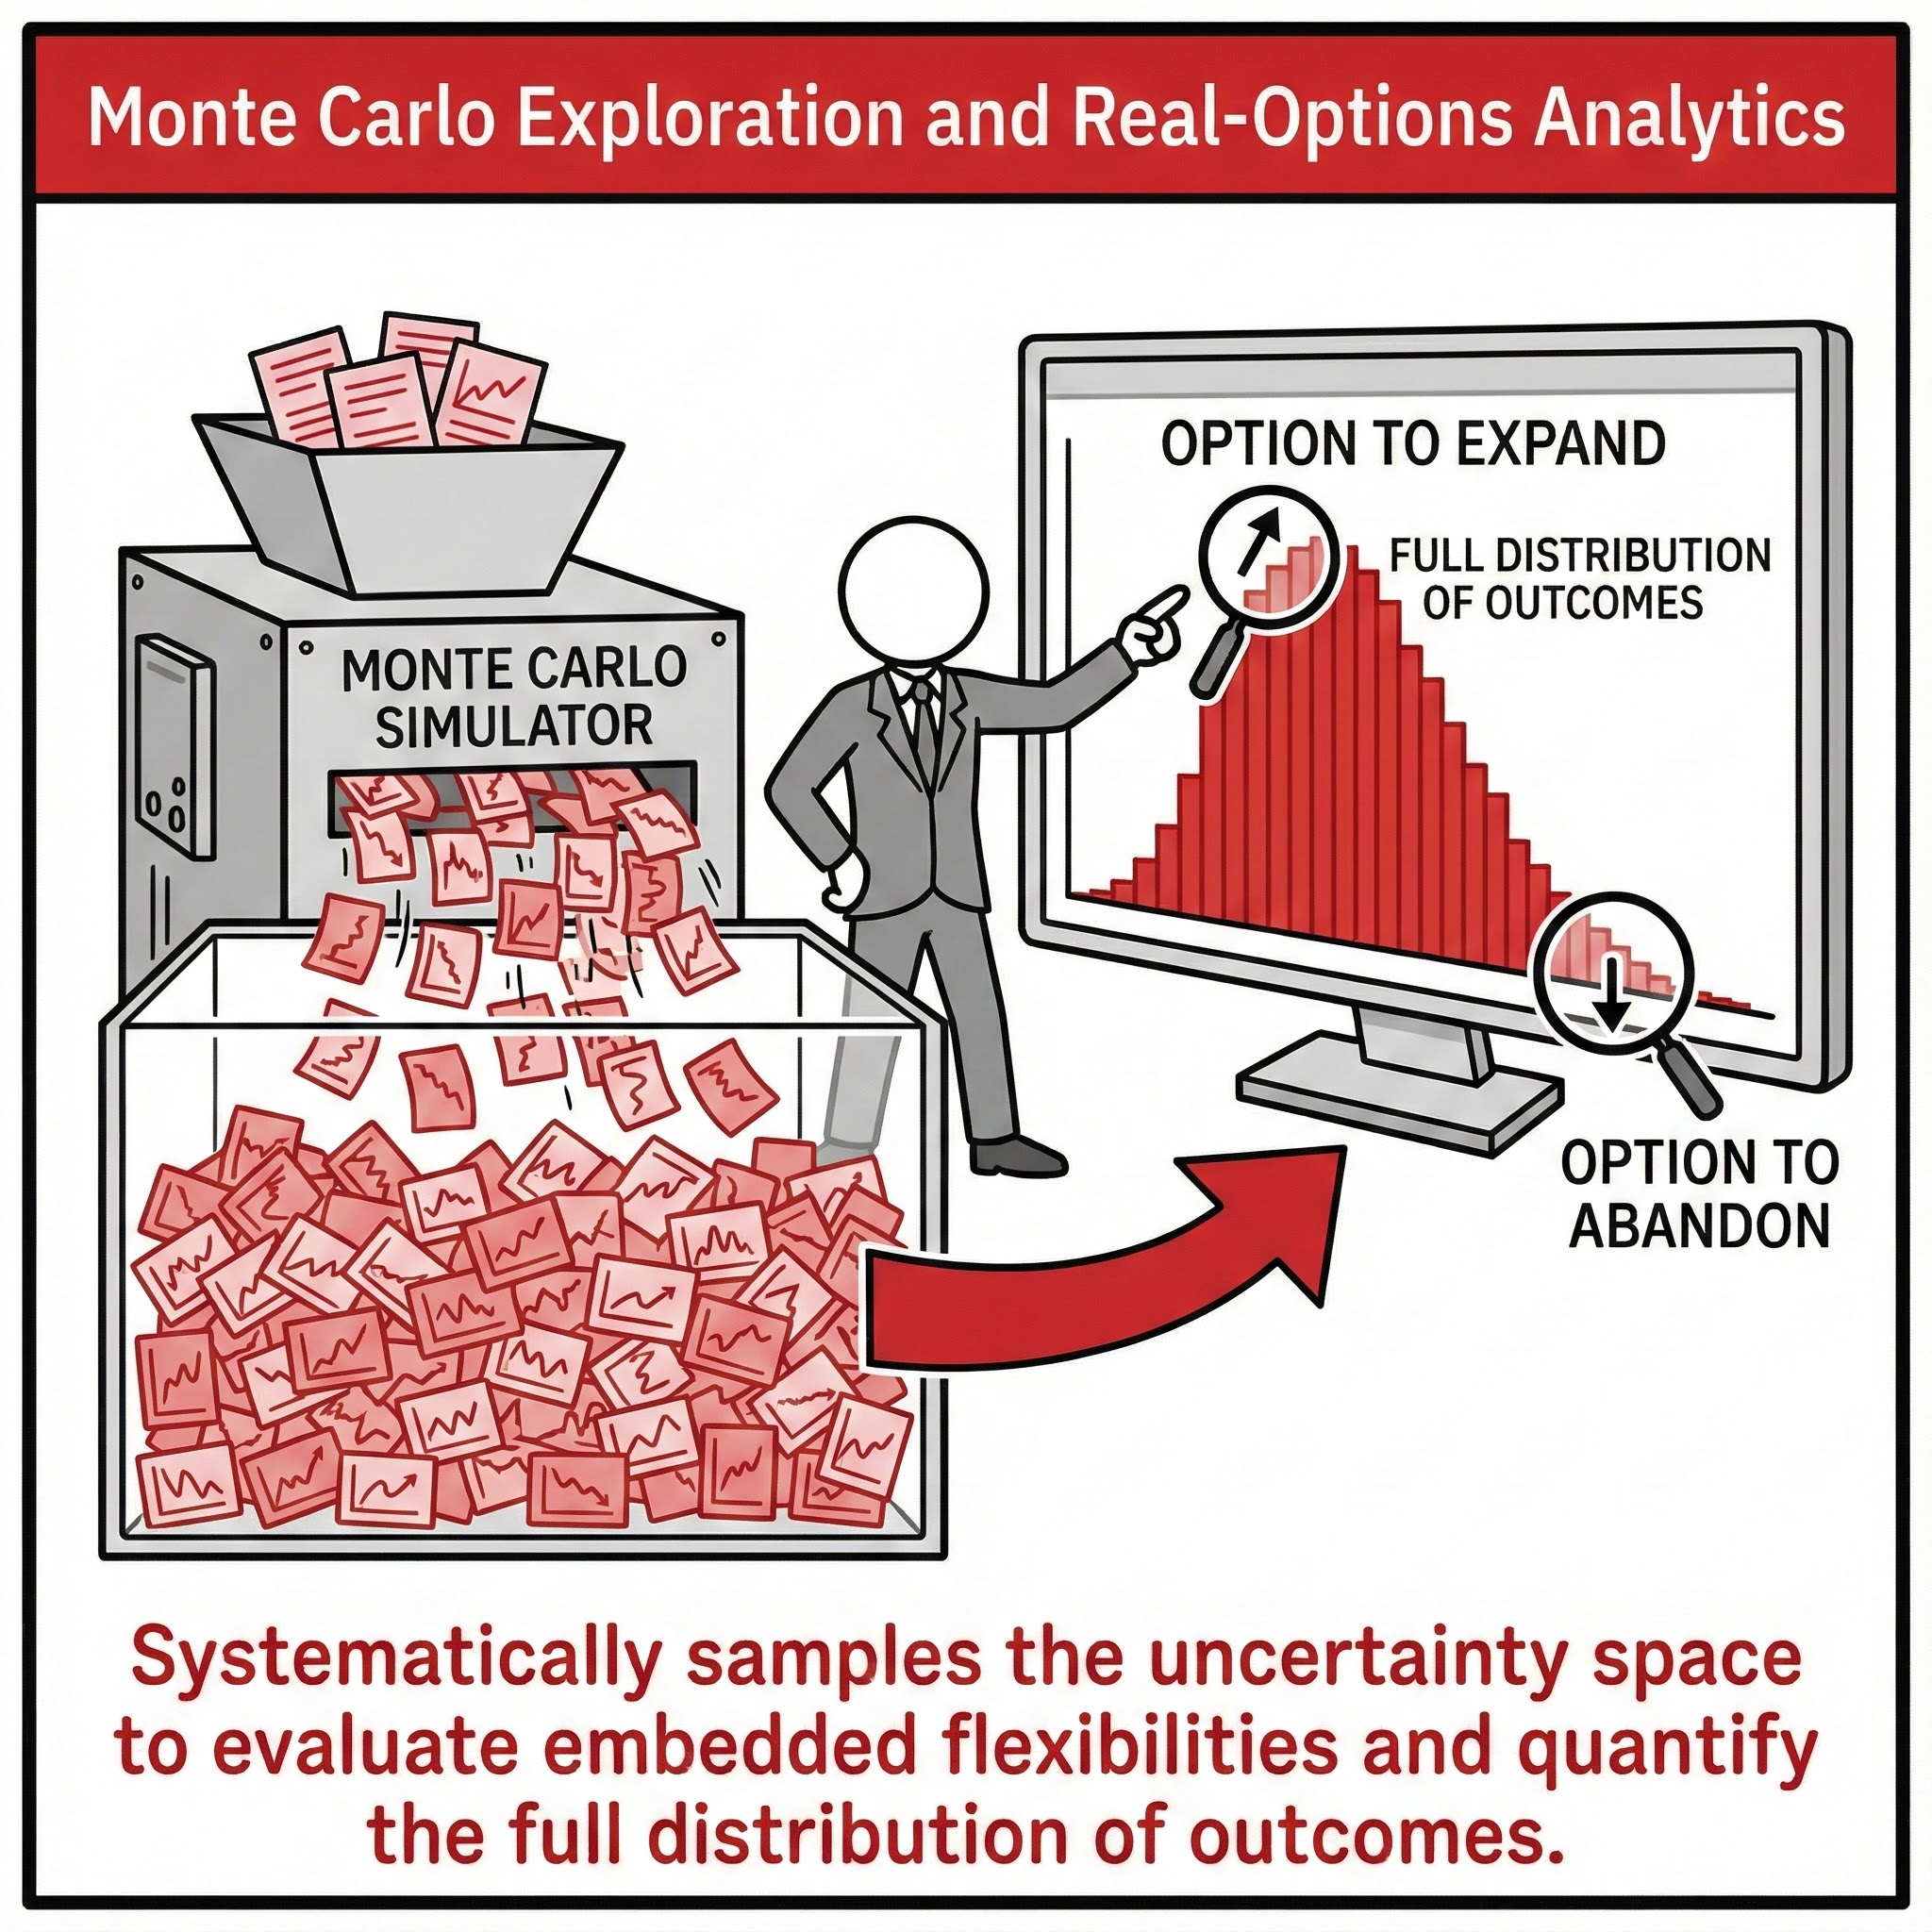
Monte Carlo Exploration & Real-Options Analytics. We simulate thousands of possible futures to find the "Efficient Frontier" of risk and return, turning uncertainty into decision metrics.
The Strategic Imperative: You cannot find the edge of the cliff by walking down the middle of the road. Standard "Base/High/Low" cases are statistically meaningless. We run 10,000+ iterations to map the full "Probability Surface." We don't just tell you the NPV; we tell you the exact probability of breaching a covenant in Year 3, allowing you to size your contingency based on math, not guesswork.
The Failure Mode: "The Lucky Forecast." A project with a massive upside but a 10% chance of total ruin often looks great on an average basis. A deterministic model hides the ruin scenario. Monte Carlo exposes it. We help Boards distinguish between "Good Risks" (high volatility, high return) and "Bad Risks" (asymmetric downside).
Practical Example: A sovereign wealth fund was considering a port expansion. The "Base Case" IRR was 14%. Our Monte Carlo simulation revealed a "bimodal" distribution: it was either a huge success (18%) or a total failure (2%)—there was no "14% scenario." The Board realized the investment was a binary gamble, not a stable yield play, and declined.
The Independent Challenge Function
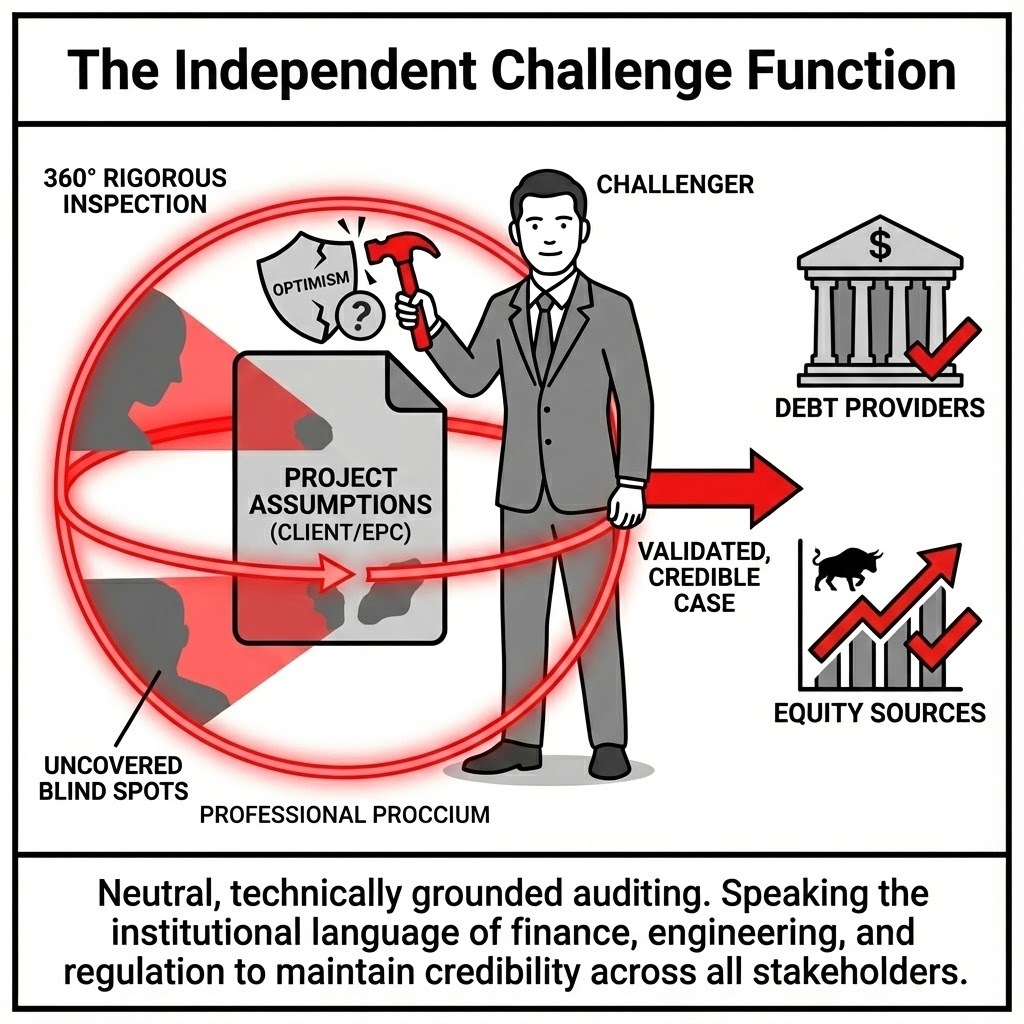
Proccium serves as the neutral, technically grounded auditor of your investment assumptions. We maintain credibility across all stakeholders—from Debt Providers to EPC Partners—by speaking the institutional language of finance, engineering, and regulation.
Our Core Deliverables
| Deliverable | Proccium Action | Value to Client | |
|---|---|---|---|
 | Assumption Vetting | Neutral review of cost structures, schedules, risk registers, and productivity estimates. | Eliminating systematic error caused by internal echo chambers. |
 | Governance Architecture | Defining decision rights and establishing transparent risk-sharing frameworks. | Building institutional alignment and securing predictable progress. |
 | Stakeholder Credibility | Operating fluently across Debt Providers, Equity Sponsors, and Regulators. | Ensuring projects retain momentum and coherence across divergent mandates. |
Begin a Confidential Discussion
If you are considering a major industrial investment—or are already navigating one—Proccium can help validate, optimize, and thoroughly de-risk your project.
The conversation begins here. office@proccium-com · +43 664 454 21 20